White Paper
White Paper
Scalable Biochemical Omics:
Achieving Parity with Sequencing
Pyxis reads all the layers of biology to predict biological outcome. Here we report advances in the breadth of biochemical omics Pyxis can interpret. Pyxis is now able to read quantitative genome-scale biochemomes at a completeness, speed, and cost that competes with sequence-based omics, drawing on machine intelligence that performs at the level of a highly-trained analytical chemist and PhD mass spectrometrist.
Application Note · Biochemical Omics · July 2026
1. The parity gap
Genomics and transcriptomics are fast, inexpensive, and comprehensive. A genome is sequenced in a day at consumable cost, on standardized pipelines in which the biology, rather than the measurement, is the object of study. Biochemical omics has not reached this level of standardization. The small molecules, lipids, peptides, and proteins read by LC-MS sit closest to phenotype, yet reading them at scale remains slow, method-intensive, and dependent on specialist interpretation. Three factors account for the gap.
Existing LC-MS methods occupy a trade-off between how many analytes they read and how well they quantify them. Targeted panels deliver calibrated concentrations on tens of analytes; untargeted metabolomics reads thousands of features but reports only relative abundance; large quantitative panels sit between the two and still fall short of genome scale. No conventional method reaches both quantitative accuracy and genome-scale breadth at once, which is the corner the sections below show Pyxis™ now occupies.

Figure 1. The quantitation-versus-breadth trade-off in biochemical omics. Established LC-MS methods lie along a frontier: targeted panels quantify accurately over tens of analytes, untargeted metabolomics reads thousands of features but only in relative terms, and large quantitative panels fall between the two. Pyxis occupies the corner that combines calibrated quantitation with genome-scale breadth. Positions are schematic.
Annotation coverage is low. Untargeted LC-MS resolves thousands of features per sample, of which a minority are assigned a structure. Reported annotation rates in metabolomics are approximately 10 percent, with the balance classified as unknowns [Kaufmann 2024]. The limitation is methodological. Identification proceeds by matching an acquired spectrum to a library of previously acquired spectra, and annotation rates remain low despite advances in spectral and fingerprint prediction [Kalia 2025]. Lipidomics exhibits the same pattern, in which only a fraction of features in untargeted datasets can be annotated, owing to missing reference spectra and undefined fragmentation rules [Züllig 2026].
Identifications are method- and software-dependent. Library matching varies with instrument, acquisition method, and software configuration. A comparison of two lipidomics platforms supplied with identical spectra reported 14.0 percent identification agreement under default settings, rising to 36.1 percent when fragmentation data were included [Pexa 2024]. Isomeric and isobaric species, which carry much of the biological signal in lipids, are frequently unresolved, and confident assignment conventionally requires manual review against authentic standards.
Quantitation does not scale. Conversion of a peak area to a concentration conventionally requires an external calibration curve and a matched stable-isotope-labeled internal standard for each analyte. The approach is accurate but resource-limited: constructing large numbers of calibration curves is laborious and error-prone [Wang 2024], and a matched internal standard for every analyte is constrained by cost and availability [Rousseau 2020]. Most untargeted studies therefore report relative abundance, which is not comparable across samples, instruments, or laboratories.
Each factor reflects a dependence on manual expert judgment, applied at method development, feature curation, and annotation. This is the cost structure that sequencing removed.
2. Approach
Pyxis is a co-scientist for biochemical omics. Pyxis reads raw LC-MS data and returns structural identifications and concentration estimates without per-analyte calibration curves, per-analyte internal standards, or analyte-specific method development. Identification and quantitation are computed as learned functions of the spectrum, using the Large Spectral Model (LSM) together with task-specific models trained on expert-curated labeled datasets. Because the outputs are predicted from the spectrum rather than retrieved from a fixed library, coverage extends to analytes without reference spectra, which is the population that library matching cannot reach.
This measurement regime complements, rather than replaces, targeted LC-MS, in the same relation that next-generation sequencing holds to quantitative PCR. Targeted assays remain the reference for validated quantitation of defined analytes on nominal-mass instruments. Pyxis provides broad, quantitative, and rapid measurement across large analyte sets, without a separate assay per analyte. Because Pyxis also interfaces with foundation models for the sequencing omics, the biochemical readouts described here compose with genomic and transcriptomic evidence within a single predictive framework for phenotype.
The sections below report performance by chemical class.
3. Small molecules
Small-molecule analysis spans two chromatographic methods: reversed-phase (RP) for nonpolar analytes and hydrophilic interaction liquid chromatography (HILIC) for polar analytes. The analyte range is not restricted to endogenous metabolites. Because concentration and structure are predicted from the spectrum rather than from a predefined panel, the same models apply to dosed drugs and their metabolites, environmental and industrial chemicals, and other xenobiotics.
3.1 Concentration prediction without calibration curves or internal standards
Pyxis predicts concentration directly from MS1 signal. On the reversed-phase benchmark (QuantRP), predictions are calibrated to ground truth with a regression slope of 0.97, coefficient of determination 0.954, median absolute percent error (MAPE) of 23.9 percent, and 76.5 percent of predictions within 30 percent of the reference value (PAE-30); within-replicate coefficient of variation (CV) is 0.093. On the HILIC production model, the trained-analyte benchmark (n = 2,097) gives MAPE 22.5 percent, PAE-30 80.0 percent, slope 0.983, and a false-positive rate on true blanks of 6.3 percent. These values are obtained without an analyte-matched standard or calibration curve.
Three quantities set the scope of the platform, and they differ by orders of magnitude. The benchmarked set, the analytes for which quantitative accuracy has been directly measured against ground truth, has grown from a few hundred reversed-phase analytes to several thousand across biological and chemical-diversity libraries, and median error on the matrix-controlled benchmark fell from above 50 percent to the low-20-percent range as it grew. Beyond the benchmarked set, because concentration is predicted from learned molecular features rather than a per-analyte calibration, quantitation extends to the broader endogenous and common-xenobiotic metabolome, an estimated population in the tens of thousands of small molecules. Structural identification reaches further still, to the full known chemical space of roughly 10⁸ compounds (Section 3.3). Figure 1 places these on a common logarithmic scale.

Figure 2. Analyte reach on a logarithmic scale. The benchmarked set (accuracy measured against ground truth) numbers in the thousands; quantitation extends by learned molecular similarity to the endogenous and common-xenobiotic metabolome (estimated tens of thousands); structural identification reaches the full known chemical space (~10⁸). Hatched bars are model-based estimates, not directly benchmarked counts.
Generalization to analytes absent from training was evaluated on a held-out reversed-phase library of biologically occurring compounds (QuantRP_Bio2K, approximately 1,000 analytes). A prior model version gave MAPE 73.9 percent, coefficient of determination 0.69, and slope 0.86. After incorporation of representative training signal, the same held-out set reached MAPE 22.6 percent, coefficient of determination 0.95, PAE-30 78.9 percent, and slope 0.997, matching in-distribution performance.
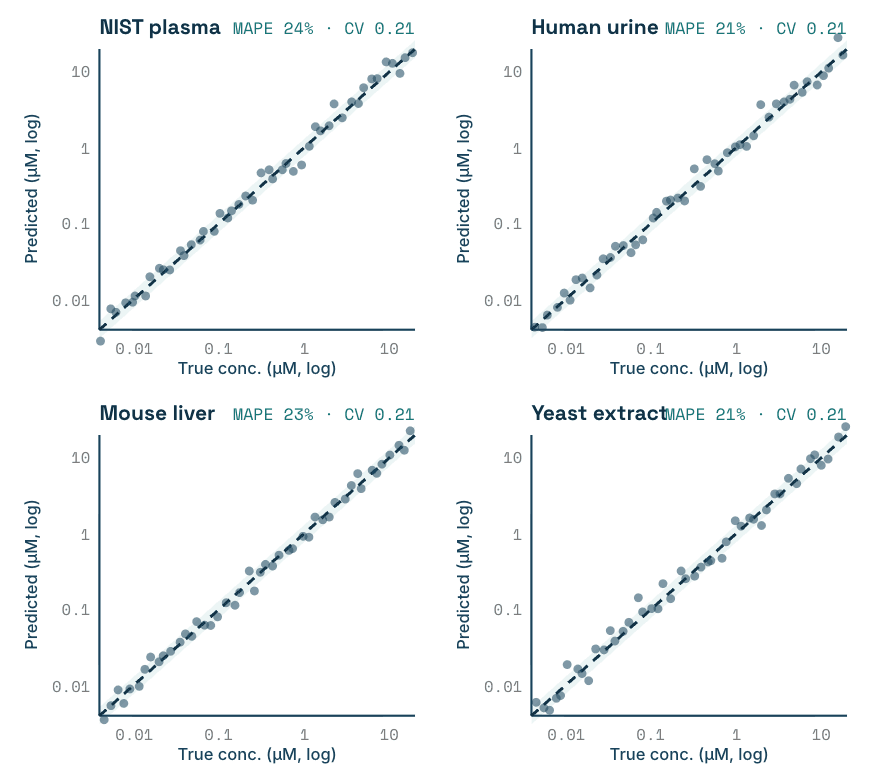
Figure 3. Predicted versus reference concentration on reversed-phase, by matrix. Coral line is identity; teal band is ±30%. Per-panel MAPE and CV shown.
This generalization is a property of the model, not of the specific analytes in the training set. Because concentration is predicted from learned molecular and chromatographic features rather than a per-analyte calibration, an analyte the model has never seen is quantified by its similarity to the chemistry the model has seen. The held-out Bio2K result shows this at scale: across roughly 1,000 biological analytes that carried no analyte-specific calibration and were absent from training, error matched in-distribution performance once representative chemistry entered the training set. Quantitation therefore extends to new chemistry as structural coverage broadens, which is the same mechanism by which sequencing generalizes across genomes.

Figure 4. Generalization to untrained analytes. On approximately 1,000 held-out biological analytes (Bio2K) carrying no analyte-specific calibration, error and slope reached in-distribution levels once representative chemistry entered training.
3.2 Matrix and instrument dependence
Matrix effects and instrument response are the principal sources of quantitative error in LC-MS. To isolate them, ten stable-isotope-labeled heavy isotopologues were spiked at a single fixed concentration into six backgrounds (NIST SRM 1950 plasma, human urine, mouse liver, mouse feces, yeast extract, and a water control) and acquired across five instrument classes. Because the true value is fixed, deviation from it measures matrix and instrument sensitivity directly.
On reversed-phase, median MAPE across the six matrices ranged from 20.8 to 24.0 percent (overall 22.1 percent), reduced from 47.5 to 53.5 percent in the prior version. By instrument, median MAPE ranged from 17.9 to 29.0 percent (overall 23.3 percent), with the largest reductions on the most out-of-distribution instruments.

Table 1. Matrix-spiked heavy isotopologue error, fixed concentration across six matrices.

Table 2. Matrix-spiked heavy isotopologue error across five instrument classes.
Two dependencies remain. A share of residual cross-instrument error is attributable to adduct-distribution differences across instruments and buffers; formate adducts are not currently represented as a distinct channel, and formate-adduct handling is in development. On HILIC, conditioning on the local total ion chromatogram reduced matrix-spiked-heavy MAPE from 38.9 to 35.7 percent and blank false-positive rate from 8.3 to 6.3 percent; on NIST plasma, the same conditioning moved the dilution-response slope away from target (−0.93 to −0.73), attributable to co-eluting plasma constituents that do not compete for ionization, and plasma matrix-effect correction is in development.
3.3 Structural identification: library retrieval and de novo
Identification operates on a coverage hierarchy. When a spectrum matches a reference, retrieval returns the highest-precision answer available. When no reference exists, which is the majority case in untargeted data, the model predicts structural properties directly from the spectrum. The two paths are complementary: retrieval maximizes precision where libraries are populated, and de novo extends coverage into the chemical space that libraries do not contain.
Reference matching is performed as an embedding-based vector search via the LSM: the spectrum and candidate library entries are embedded, and retrieval ranks candidates by similarity in that space rather than by cosine similarity of raw peak lists. On the public MassSpecGym benchmark, this improves rank-1 hit rate by 13.4 percentage points over the cosine baseline, and reduces the false-positive rate at high-confidence score from 8.2 percent to 0.9 percent. On NIST SRM 1950 plasma, evaluated against the NIST and Mandal et al. reference set, metabolite recall is 89.2 percent (364 of 408).

Reference libraries contain experimental spectra for a small fraction of known compounds, so retrieval alone leaves most features unidentified. To reach these, Pyxis predicts a molecular fingerprint and a set of calibrated physicochemical descriptors, for example logP, compound class, and drug-likeness, directly from the MS2 spectrum, then ranks candidates drawn from the known chemical space of approximately 10⁸ compounds in databases such as PubChem, HMDB, and ChEMBL. This reframes structure determination from an ill-posed generation problem into a retrieval problem against enumerated chemistry, and expands the addressable space from the roughly 10⁶ compounds with reference spectra to the full known set. The descriptor predictions are usable outputs in themselves: a compound class or a logP value for an otherwise unidentified feature supports interpretation before a full structure is assigned.

Figure 5. Identification coverage. Retrieval is bounded by compounds with reference spectra; de novo prediction extends to the known chemical space.
De novo structure identification is an area of rapid development. Current published methods reach approximately 18 percent top-1 accuracy on out-of-distribution benchmarks, which sets the reference point for the task. Matterworks is extending the retrieval approach with a generative model that proposes a candidate structure, as a SMILES string, directly from a spectrum, including for compounds absent from any reference set. The capability is being evaluated in independent, third-party structure-identification benchmarks, and generated candidate structures with calibrated confidence are expected to reach the Pyxis platform within the coming months.
4. Lipids
Lipid identification is constrained by the same library-coverage limit as small-molecule metabolomics, and more acutely: LIPID MAPS catalogs over 60,000 lipid species, while public spectral libraries contain reference spectra for a small fraction of them. The biologically informative distinctions in lipidomics, chain length, degree of unsaturation, and bond type, are carried at the species level, and isomeric and isobaric species are frequently unresolved by library matching. Pyxis identifies lipids by the same two paths used for small molecules: embedding-based vector search against a reference library where a match exists, and de novo prediction of lipid class, species, and bond type directly from the MS2 spectrum where it does not.
4.1 AdipoAtlas benchmark
Performance was evaluated against AdipoAtlas, a published reference lipidome of human white adipose tissue (Lange et al., Cell Reports Medicine, 2021; Metabolomics Workbench ST001738). The reference set was constructed by the original authors from the consensus of three lipidomics software tools plus manual curation, which makes it a well-characterized true-positive set in a biological matrix. Evaluation used the fraction addressable by the reversed-phase methods Pyxis runs (C18 for polar lipids, C30 for triacylglycerols), comprising 505 species.
Across the combined C18 and C30 data, Pyxis recovered 394 of 505 reference species (80 percent) at high confidence (similarity ≥ 0.91). Including medium- and low-confidence bins, 431 of 505 (85 percent) were recovered. By fraction, recall was 258 of 367 (70 percent) on the polar C18 lipids and 85 percent on the C30 triacylglycerols.
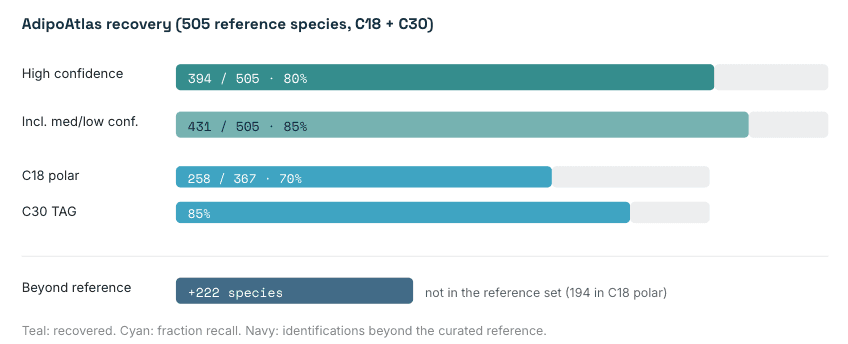
Figure 6. Recovery on the AdipoAtlas reference lipidome, with species identified beyond the reference set.
Beyond the reference set, Pyxis returned 222 additional species not reported in AdipoAtlas, of which 194 were in the polar C18 fraction. Two examples, verified by manual review of MS2 fragmentation against the LipidMatch database:
PC 32:3 (phosphatidylcholine), lower in the obese group in visceral adipose tissue, and the most differentially abundant phosphatidylcholine relative to its near-mass neighbors in that contrast.
PC O-40:4 (a plasmanyl ether-linked phosphatidylcholine), longer than any ether-linked PC reported in the reference, which caps at PC O-38:6.
4.2 Class-level behavior
Two categories inform current use. Ether (O-) and vinyl-ether (P-) isomers are over-reported: for the PC O-40:4 example above, both the alkyl and alkenyl isomers were returned as separate identifications. These are not resolvable by MS2, nor, in these data, by the chromatography, and should be reported as a single call; collapsing them is a defined output change. Cholesterol esters were not returned in these data; cholesterol ester support is in development.
A third pattern is instructive for interpretation of de novo lipid calls. One de novo identification, Cer 35:2;O4, was assigned high confidence and showed a greater than two-fold increase in the obese group. Review of the fragmentation identified it as the formate adduct [M+HCOO]⁻ of Cer 34:2;O2, a known ceramide, rather than a novel species; the two ions are near-isobaric (580.495 vs. 580.496). The formate adduct is expected, because the acquisition buffer contained 0.1 percent formic acid, and [M+HCOO]⁻ is not currently represented as a named adduct in the identification pipeline. Ceramides, which ionize poorly as [M−H]⁻ and readily form formate adducts, are the most exposed class. As in Section 3.2, formate-adduct handling is in development.
4.3 Lipid quantitation
Concentration prediction for lipids follows the small-molecule approach and is in development, expected to ship in 2026. The results above are identification only.
5. Peptides and proteins
In bottom-up proteomics, proteins are enzymatically digested into peptides, the peptides are sequenced, and the sequences are mapped back to their source proteins. Pyxis addresses the sequencing step by de novo interpretation, determining an amino-acid sequence directly from an MS2 spectrum without reference to a protein database, and then maps the resulting peptides to proteins. The application that most requires this is immunopeptidomics: human leukocyte antigen (HLA) presented peptides do not follow the cleavage rules of tryptic proteomics, and many derive from non-canonical sources absent from reference databases. Database search addresses this by enumerating a larger candidate space, which inflates the search space and lowers identification sensitivity [Wilhelm 2021]. Transcriptome-informed databases are the alternative, but require matched RNA sequencing and still miss spliced and other non-canonical peptides. De novo sequencing removes the database dependency.
Pyxis peptide sequencing is evaluated against the strongest open-source de novo model as a reference point. Performance separates by cleavage type.
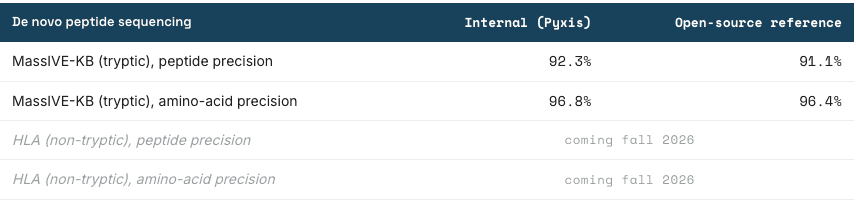
Table 3. De novo peptide sequencing precision versus the strongest open-source model.
On tryptic peptides, the internal model is at parity with or ahead of the strongest open-source reference (92.3 versus 91.1 percent peptide precision; 96.8 versus 96.4 percent amino-acid precision). Non-tryptic sequencing, the immunopeptidomics target, is in active development, with benchmarking to be reported in fall 2026. One constraint applies across all current de novo models, including the reference: sequencing accuracy on TMT-labeled spectra is low, and TMT workflows are not addressed. Benchmarks follow field convention in treating isobaric residues (leucine and isoleucine; lysine and glutamine within mass tolerance) as equivalent.
5.1 Mapping peptides to proteins
Sequenced peptides are mapped to source proteins by sequence search against a protein database, with an allowance for single-residue mismatches so that sequence variants, including point mutations of the kind relevant to cancer neoantigen work, are captured rather than discarded. On a published cancer proteomics dataset (PXD014062), 77.9 percent of high-confidence de novo peptides mapped to the study’s reference protein set, and single-mismatch matching added a further 29,000 proteins with at least one supporting peptide. Compared against database-search engines on the same data, at every peptide-support threshold the de novo pipeline recovered at least as many proteins: at five or more supporting peptides per protein, 7,033 proteins versus 5,845 (Sage), 5,786 (Comet), and 5,000 (a commercial database search). Protein-level inference is in development for the Pyxis platform; the biological value of the peptide readout is its connection to the protein, and to phenotype, rather than the peptide sequence in isolation.
6. Summary
Across three chemical classes, Pyxis performs structural identification and concentration determination at a level consistent with trained analytical interpretation, computed directly from raw LC-MS data. On small molecules, concentration prediction reaches a slope near unity and MAPE in the low-20-percent range without calibration curves or internal standards, and holds across six matrices and five instrument classes. Structural identification combines embedding-based retrieval, which raises rank-1 hit rate 13.4 points over the cosine baseline and recovers 89.2 percent of metabolites in NIST plasma, with de novo prediction that extends coverage from the roughly 10⁶ compounds with reference spectra toward the approximately 10⁸ known. On the AdipoAtlas reference lipidome, Pyxis recovers 80 percent of addressable species and returns 222 beyond the reference set. On tryptic peptides Pyxis matches the strongest open-source de novo sequencer, and the resulting peptides map to source proteins at rates that meet or exceed database search, extending the same approach to bottom-up proteomics.
The result is broad, quantitative, rapid measurement that does not depend on per-analyte standards or manual method development, produced at a throughput and cost that place biochemical omics on the same footing as sequencing. It complements targeted LC-MS rather than replacing it, in the same relation that next-generation sequencing holds to quantitative PCR, and it composes with the sequencing omics in a single framework for predicting phenotype from raw data.
Items in development, referenced above: cholesterol ester identification, ether/vinyl-ether isomer collapsing, formate-adduct handling, lipid quantitation (expected 2026), non-tryptic peptide sequencing (benchmarking in fall 2026), protein-level inference, and generative de novo structure identification.
References
Kaufmann M. et al. From samples to insights: uncovering biologically relevant information in LC-HRMS metabolomics data. *Metabolites* (2024).
Kalia A. et al. JESTR: joint embedding space technique for ranking candidate molecules for the annotation of untargeted metabolomics data (2025).
Züllig T. et al. A lipidomics roadmap: from basic research to societal challenges. *Nature Communications* (2026).
Pexa B. et al. Challenges in lipidomics biomarker identification: avoiding the pitfalls and improving reproducibility. *Metabolites* (2024).
Wang J. et al. A scalable approach to absolute quantitation in metabolomics. *bioRxiv* (2024).
Rousseau K. et al. Quantifying precision loss in targeted metabolomics based on mass spectrometry and non-matching internal standards (2020).
Wilhelm M. et al. Deep learning boosts sensitivity of mass spectrometry-based immunopeptidomics. *Nature Communications* (2021). Data: PXD021013.
Lange M. et al. AdipoAtlas: a reference lipidome for human white adipose tissue. *Cell Reports Medicine* (2021). Data: Metabolomics Workbench ST001738.
Public benchmarks and reference materials: MassSpecGym; MassBank; NIST SRM 1950 and RM 8231; MassIVE-KB.