EXPERTISE BRIEF
NEW EXPERTISE BRIEF
Quantitative Genome-Scale Flux Balance Analysis from Untargeted Biochemical Omics
Calibrated micromolar concentrations from the Pyxis co-scientist constrain personalized metabolic models and recover canonical type 2 diabetes biology.
Summary
Broad untargeted concentrations determined by Pyxis™ enable quantitative metabolic modeling. Pyxis recapitulates known mechanistic biochemistry when using relative quantitation signals from conventional untargeted metabolomics fails. Its adoption at genome scale has tracked three attributes established by genomics: breadth, quantitation, and scale. The Pyxis co-scientist, built on the Matterworks Large Spectral Model (LSM), reports calibrated concentrations for thousands of analytes from a standardized untargeted acquisition spanning HILIC- and RP-compatible analytes. This brief describes the application of those measurements to quantitative flux balance analysis (qFBA), in which calibrated micromolar (μM) concentrations constrain personalized genome-scale metabolic models and recover established type 2 diabetes (T2D) biology (Ferro et al., 2024).
Background
Untargeted metabolomics reports relative peak areas, a signal that reflects instrument response and varies with ionization efficiency and matrix composition. Targeted assays report calibrated concentrations for a defined panel of analytes that carry matched standards. Genome-scale metabolic models require concentrations to set physically meaningful reaction bounds, so their use with untargeted data has relied on rank-based approximations. The application of machine learning to spectral data carries documented challenges (Khoo and Barzilay, 2026). The LSM approaches concentration estimation by learning structural and quantitative representations directly from raw fragmentation spectra (Asher et al., 2024).
Platform
Parameter
Value
Foundation model
Large Spectral Model (LSM); more than ten billion raw mass spectra across more than 1.9 million biological contexts
Quantitation benchmark
3,035 chemical standards (metabolites, lipids, peptides, drugs); 384-well plates, up to 640 analytes per well; four orders of magnitude
Matrix panel
Human urine, rat liver, yeast extract, mouse feces, and NIST SRM 1950 plasma; 989 identified, 415 with linear peak areas, 235 above the limit of quantitation
Accuracy and precision
PAE30, MAPE, SMAPE, R-squared, and CV
Acquisition
Seven-minute full-scan polarity-switching method, Thermo Scientific Orbitrap Exploris 120, reversed-phase LC-MS, cloud-hosted processing
The LSM is a foundation model trained on more than ten billion raw mass spectra across more than 1.9 million biological contexts, spanning small molecules, lipids, peptides, and proteins (Asher et al., 2024). Pyxis applies the model to four tasks: structure identification, concentration estimation without per-analyte calibration standards, embedding-based batch-effect correction, and phenotype prediction. The concentration model was benchmarked across a chemically diverse standard library and five biological matrices (Ferro et al., 2024). Table 1 summarizes the platform and benchmark parameters.
Table 1. Pyxis platform and quantitation benchmark parameters (Asher et al., 2024; Ferro et al., 2024).
Application: quantitative FBA
The qFBA pipeline was applied to reference plasma cohorts. NIST SRM 1950 (healthy pool) and RM 8231 (T2D and hypertriglyceridemic pools) were profiled on HILIC and reversed-phase LC-MS, yielding 1,415 analytes above a 2.5-fold blank-filter threshold and reported in calibrated μM. A young-adult pool was held out from downstream comparison because it carried a different anticoagulant. Each analyte was resolved to a Virtual Metabolic Human identifier. All 1,559 default-open extracellular exchange reactions in Recon3D were closed, a defined plasma medium of 52 essentials was reopened, and each measured μM value set the lower bound on its corresponding exchange through MetaboTools scaling. A quartile-rank rule provided a qualitative comparison. Parsimonious FBA was solved on each personalized Recon3D model, per-subsystem summed absolute flux was aggregated, and a trust filter removed subsystems whose differences were governed by reactions at the solver bound. Driver attribution linked each subsystem change to its underlying μM measurements.
Results
Calibrated μM concentrations from Pyxis produced exchange-flux bounds within the range of per-tissue uptake rates in the physiology literature, below the maximum hepatocyte glucose uptake of approximately 2 mmol per gram dry weight per hour (Watanabe et al., 2004). That reference marks the boundary between the biologically valid and biologically implausible ranges. Quartile-rank bounds from untargeted metabolomics fall in the implausible range, and μM-scaled bounds fall in the valid range (Figure 1, Table 2).
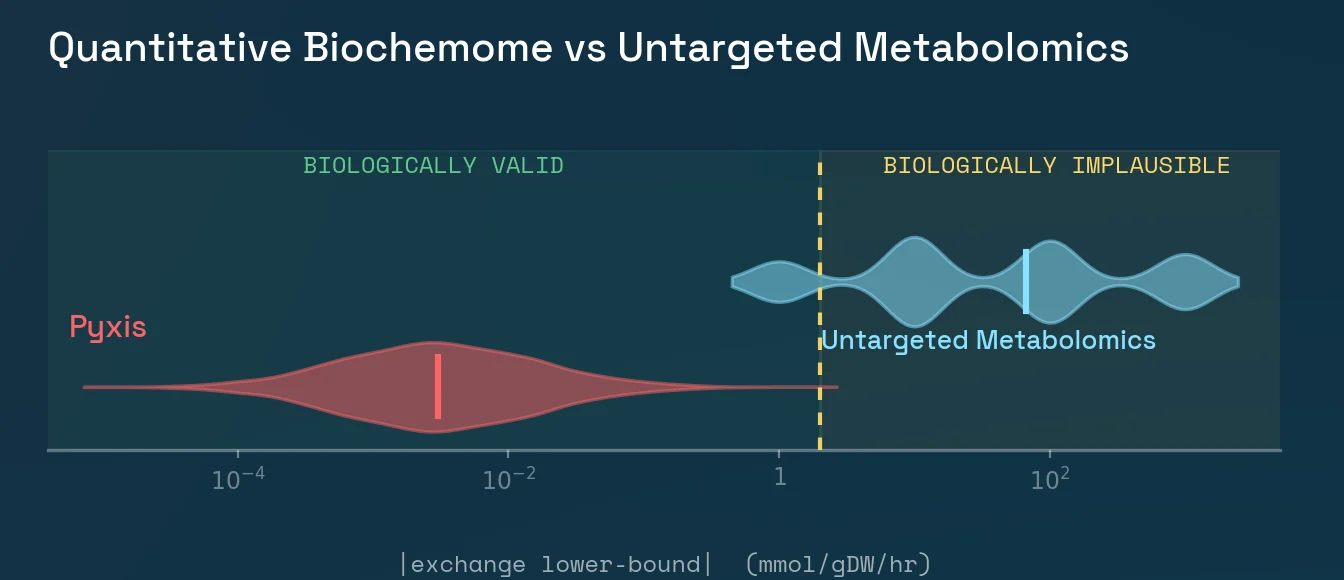
Figure 1. Distribution of absolute exchange-reaction lower bounds under each bound-translation rule. Calibrated μM concentrations (Pyxis) place bounds in the biologically valid range; quartile-rank bounds from untargeted metabolomics fall in the biologically implausible range. The dashed line marks the plausibility boundary (Watanabe et al., 2004).
Exchange-flux lower bounds
Untargeted qualitative
Pyxis quantitative
Bound-translation rule
μM × MetaboTools scaling
Bound distribution
Discrete {1, 10, 100, 1000}
Continuous
Median |lower bound| (mmol/gDW/hr)
≈ 10
≈ 0.003
Bounds above published per-tissue uptake
62%
1%
Table 2. Exchange-flux lower bounds under qualitative and quantitative bound-translation rules.
Plasma concentrations of the leading driver metabolites, including glutamate, the branched-chain amino acids leucine, isoleucine, and valine, alpha-ketoglutarate, succinate, pyruvate, urate, and xanthine, reproduced the canonical T2D biomarker direction across cohorts (Figure 2). Quantitative μM-scaled bounds recovered the published T2D direction for 7 of 7 pathways with a decisive literature direction, and quartile-rank bounds matched 5 of 7, with reversals in glutamate and branched-chain amino acid metabolism (Table 3).

Figure 2. Per-cohort plasma concentrations (μM, symmetric-log axis) for the nine metabolites whose μM-derived bounds carry the largest signal into the quantitative pFBA subsystem hits. Each row lists the published T2D direction and the supporting reference.
Recon3D subsystem
Untargeted qualitative
Pyxis quantitative
Literature
Reference
Glutamate metabolism
↓
↑
↑
Felig 1969; Menni 2013
Branched-chain amino acids (Val, Leu, Ile)
↓
↑
↑
Wang 2011; Newgard 2009
Purine catabolism
↑
↑
↑
Hyperuricemia / T2D consensus
Citric acid cycle
↑
↑
↑
Serena 2018; Sabatine 2005
Pyruvate metabolism
↓
↓
↓
Insulin-resistance studies
Leukotriene metabolism
↑
↑
↑
Chronic inflammation in T2D
Eicosanoid metabolism
↑
↑
↑
Chronic inflammation in T2D
Table 3. Direction-match scorecard for the leading cohort-differential Recon3D subsystems. Pyxis bounds are quantitative (μM-scaled flux); untargeted bounds are qualitative (direction only). Arrows give the predicted T2D-versus-healthy flux direction, with green marking agreement with the published literature direction and red marking disagreement. Quantitative bounds match the literature for 7 of 7 decisive pathways; qualitative bounds match 5 of 7.
Applications
Concentration-resolved biochemical omics extends genome-scale metabolic modeling to routine cohort studies and supports mechanism-of-action discovery, target identification, pharmacodynamic biomarker development, and patient stratification. The seven-minute acquisition and cloud-hosted analysis place these outputs within the throughput and cost range of sequence-based study designs. The workflow is a form of poly-intelligence: Pyxis supplies the calibrated concentrations that untargeted data alone cannot, the research team supplies the genome-scale models and the biological interpretation, and together they recover disease mechanisms that neither could resolve alone.
References
1. Asher G, Delmar MC, Campbell JM, Geremia J, Kassis T. LSM1-MS2: A Foundation Model for MS/MS, Encompassing Chemical Property Predictions, Search and de novo Generation. chemRxiv. 2024. doi:10.26434/chemrxiv-2024-k06gb-v3.
2. Ferro LS, Wong AYL, Howland J, Costa ASH, Pruyne JG, Shah D, Lauterbach JD, et al. A Scalable Approach to Absolute Quantitation in Metabolomics. bioRxiv. 2024. doi:10.1101/2024.09.09.609906.
3. Khoo A, Barzilay R. Nature Metabolism. 2026. doi:10.1038/s42255-026-01544-6.
Clinical and physiological literature cited in the qFBA analysis (Ferro et al., ASMS 2026, poster TP 502): Felig et al., 1969; Sabatine et al., 2005; Newgard et al., 2009; Wang et al., 2011; Menni et al., 2013; Serena et al., 2018; Watanabe et al., 2004.
Keep reading
Calibrated concentrations from Pyxis constrain personalized metabolic models and recover canonical type 2 diabetes biology.
Discover the meaning in your measurements
Engage with Pyxis on a new experiment or discover the novel biology hidden in data you already have.