Insight Series
Two novel signals in the pancreatic-cancer biochemical omics that would go missed by targeted analysis alone
A Pyxis reanalysis of untargeted LC-MS lipidomics from pancreatic tumor and adjacent-normal tissue surfaced two signals a targeted analysis would have missed: a tissue-level depletion of Coenzyme Q₁₀ with no direct precedent in the indexed PDAC literature, and sample-level flags for specimens whose molecular profile does not match their assigned label.
A short brief on the findings that emerged during a broader reanalysis of biochemical omics data across cancer detection settings, framed for pancreatic ductal adenocarcinoma. Findings and interpretations are stated in the scientific voice of the manuscript from which they are drawn.
Scope of this brief. This brief reports two novel observations from a Pyxis™ reanalysis of untargeted LC-MS lipidomics of pancreatic ductal adenocarcinoma tumor tissue and adjacent normal pancreas. Benchmarking details and specimen-level information appear in the companion manuscript and are omitted here. The focus is on the signals that were not surfaced by prior work and on the class of interpretation that untargeted biochemical omics adds to bulk-tissue comparison.
01 · A tissue-level depletion of Coenzyme Q₁₀ in pancreatic ductal adenocarcinoma without a direct precedent in the indexed literature
Among the differentially abundant analytes recovered by the reanalysis, ubidecarenone (Coenzyme Q₁₀) is depleted in tumor tissue relative to patient-matched adjacent normal pancreas with a log₂ fold-change of −1.78 (Welch’s t, p = 9.5×10⁻⁴; Benjamini–Hochberg q = 4.7×10⁻³; Figure 1). The magnitude of the depletion places CoQ₁₀ within the top-ranked features of the tumor-versus-normal signature and comparable in effect size to the phosphatidylcholine and diacylglycerol species that dominate the top of the volcano plot (Figure 2).
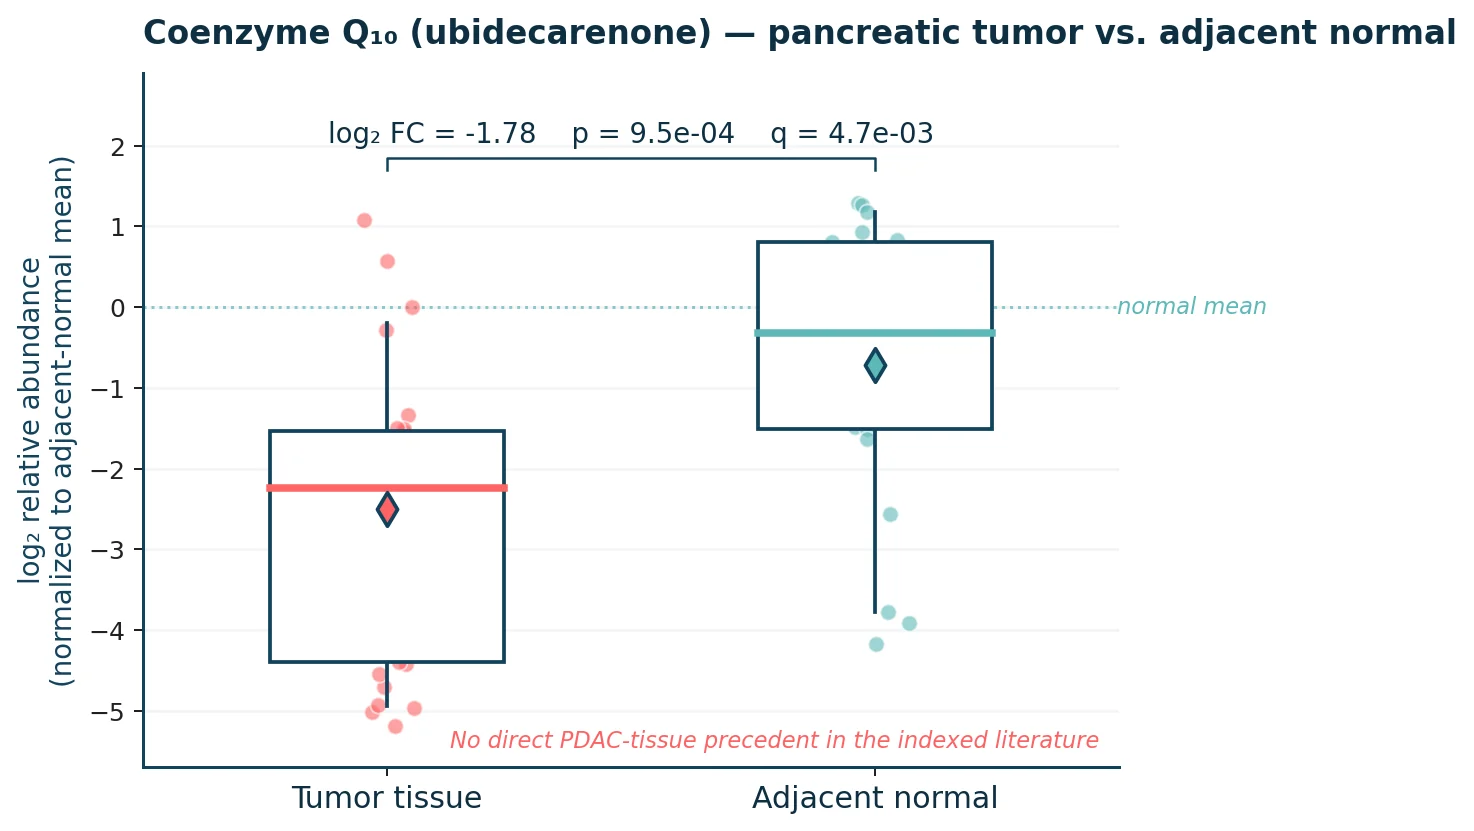
Figure 1. Coenzyme Q₁₀ (ubidecarenone) abundance in pancreatic tumor and adjacent-normal tissue. Each sample’s abundance is expressed on the log₂ scale relative to the mean of the adjacent-normal group; the dotted reference line at zero marks that normalization point. Central bar within each box marks the median; diamond marks the group mean. The between-group shift meets the combined significance and effect-size thresholds used throughout the reanalysis. The observation does not have a direct PDAC-tissue precedent in the indexed literature.
Why this is novel
A PubMed and Google Scholar search for “PDAC” combined with “Coenzyme Q10”, “CoQ10”, or “ubidecarenone” returns no primary study that quantifies endogenous CoQ₁₀ in resected PDAC tissue relative to adjacent normal pancreas. The closest published analogue is a report in astrocytoma tissue, where endogenous CoQ₁₀ and the abundance of several COQ-pathway proteins are inversely correlated with malignancy grade [1]. The single PDAC-specific reference concerns the pharmacology of exogenous CoQ₁₀ delivery: raising the mitochondrial Q-pool with exogenous ubidecarenone triggers ROS-mediated apoptosis in PDAC organoids and xenografts [2]. That result is consistent with PDAC cells operating in a low-CoQ₁₀ state that is displaced when the pool is restored, but it does not itself measure the endogenous pool.
The present observation therefore adds a direct tissue-level measurement to that pharmacological argument. The depletion is not attributable to a shared calibration error: the same specimens carry the expected pancreatic-tissue signatures for phospholipid classes with well-documented behavior, and the CoQ₁₀ shift is anchored on species detected across the majority of the specimens.
Interpretation and next steps
The direction of the shift is compatible with two non-exclusive mechanisms:
Reduced de novo biosynthesis of the mevalonate–isoprenoid pathway output in tumor tissue, consistent with oncogene-driven redirection of acetyl-CoA away from downstream isoprenoids and toward mitochondrial oxidation [3].
Elevated turnover of the mitochondrial CoQ pool through the same electron-transport-linked oxidative pressure that Dadali et al. exploited pharmacologically [2].
Both mechanisms would leave the bulk tissue pool depleted. Targeted quantification with an internal standard, and stratification by tumor grade and stage in a larger cohort, are the appropriate follow-up experiments. The observation is worth an independent replication before it enters the discussion as a candidate biomarker.
02 · Bulk-tissue biochemical omics as an interpretive layer for confounded pancreatic specimens
Bulk-tissue metabolomics of pancreatic specimens is confounded by three biological features that are common in this cancer type and that are difficult to detect from label metadata alone:
Variable neoplastic cellularity within the tumor block [4,5]
Chronic pancreatitis and acinar-to-ductal metaplasia in adjacent-normal parenchyma [6]
Residual tumor infiltration into what is designated as adjacent normal on the resection map
Each of these produces a specimen whose histological label and whose molecular composition are partially decoupled, and each has been documented as a source of noise in bulk-tissue biomarker studies [4,5,6].
The reanalysis surfaced two anonymized patterns that map onto these confounders (Figure 3). A subset of specimens labeled as tumor projects into the region of the metabolomic space occupied by adjacent-normal tissue. A separate subset of specimens labeled as adjacent normal projects into an intermediate region, carrying a partial version of the depletion signature that characterizes the tumor cluster. Neither pattern is recoverable from label metadata alone. Both are recoverable from the untargeted biochemical omics profile without any prior knowledge of the histology.

Figure 3. Bulk-tissue biochemical omics identifies specimens whose molecular profile does not match their assigned label. Projection of the pancreatic specimens onto the first two principal components of the log-transformed relative-abundance matrix. Circles mark specimens whose signature agrees with their label. Diamonds mark tumor specimens whose signature is closer to the adjacent-normal centroid than to the tumor centroid. Squares mark adjacent-normal specimens carrying a partial version of the tumor depletion signature. These flags emerge from the metabolomics alone and are candidates for histopathologic re-review.
Why this matters
Neither pattern is a machine-learning error and neither is visible in aggregate classifier accuracy. Both are visible in the unsupervised low-dimensional embedding of the biochemical omics itself, and both admit a specific class of interpretation that is difficult to obtain without spatial or single-cell resolution:
Tumor specimens with normal-like signatures. Consistent with low neoplastic cellularity, the specimen is composed predominantly of desmoplastic stroma and entrapped acinar parenchyma, in the 10–80% cellularity range that Li et al. documented in laser-microdissected PDAC tissue [4]. Also consistent with a well-differentiated or non-conventional PDAC in which acinar-like lipid metabolism is retained, of which Alonso-Curbelo et al. identified a plasma-metabolome subtype with broadly normal lipid content [7].
Normal-adjacent specimens with partial depletion. Consistent with field cancerization, chronic pancreatitis, or acinar-to-ductal metaplasia in the resection margin, histological findings that reshape lipid metabolism in tissue that would otherwise be scored as histologically normal [5,6]. Casolino et al. have shown that systemic inflammation in PDAC patients reshapes lipid pools even at distal sites [8], and the equivalent local process would produce the pattern observed here.
What biochemical omics adds to bulk-tissue interpretation
The confounders described above are, in principle, addressable by spatial mass-spectrometry imaging, single-cell sequencing, and laser-microdissection-guided proteomics [5]. Those methods are the appropriate resolution for the underlying biology but are not universally available at the point of a bulk-tissue reanalysis. Untargeted LC-MS profiling of the same bulk extract adds a distinct layer: it does not localize the signal in space, but it reports whether the molecular composition of the specimen is consistent with its assigned label. That is a different question from “what is the tumor made of” and is a useful one for cohort quality control before downstream marker validation. The Pyxis pipeline used in this reanalysis produced these flags without prior knowledge of the sample histology and without any manual feature selection; the flags themselves are the primary output.
Where the specimen labels are confirmed by histology, the flags argue for stratifying downstream analyses by tumor cellularity and by adjacent-normal histopathological grade. Where a flag conflicts with the assigned label, the appropriate next step is re-review of the source block, a resolution that, when it is possible, either confirms the biochemical omics finding or provides a corrected label that improves the reference cohort.
Position within the broader PDAC lipidomics literature
The reanalysis also touched on a set of previously reported observations. The directional pattern reported here, coordinated depletion of phosphatidylcholines, phosphatidylinositols, plasmalogen phosphatidylethanolamines, sphingomyelins, diacylglycerols, triacylglycerols, and free polyunsaturated fatty acids in tumor tissue relative to adjacent normal, is consistent with earlier LC-MS bulk-extract PDAC studies [9,10,11] and with lipidomic profiling of pre-diagnostic serum from prospective cohorts [12,13]. It is opposed to the direction reported by MALDI-MSI of intact tumor slices and by HR-MAS NMR of intact tissue blocks, which report elevated phosphatidylcholines, sphingomyelins, and choline head groups in tumor [14,15]. The reconciliation supported by the specimen-composition literature is that spatial methods preserve the tumor-epithelium signal while bulk-extract methods integrate over the specimen; both directions can be correct at their respective spatial scales [4,5].
Within that framework, one specific finding of the reanalysis represents a direct disagreement with a prior report: the depletion of linoleic acid (log₂FC = −2.07) and 20:5n-3 eicosapentaenoic acid (log₂FC = −2.34) contradicts Zhao et al., who reported linoleic, palmitic, and arachidonic acids elevated in PDAC tissue and serum in a multicenter cohort [16]. This divergence is unresolved and is a candidate for independent replication in a stage-stratified cohort, Liu et al. have shown that pancreatic tissue lipid content varies systematically with T-stage, which would provide one candidate mechanism for the disagreement [11].
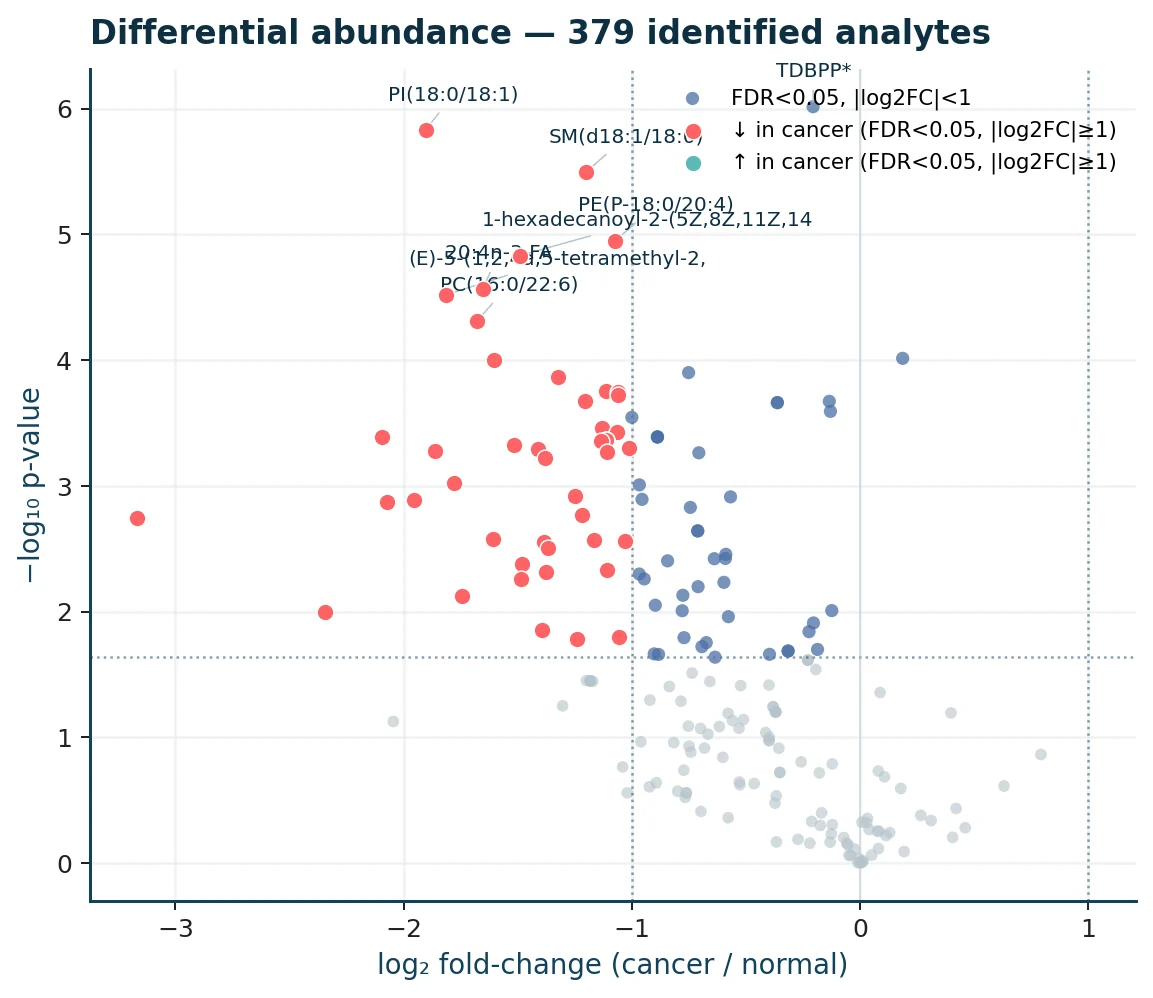
Figure 2. Differential abundance of identified analytes, tumor vs. adjacent normal. Coral: significant at FDR < 0.05 with |log₂ FC| ≥ 1 and depleted in tumor. Teal: significant and elevated in tumor. Slate: significant at FDR < 0.05 with sub-threshold effect size. Grey: not significant. The volcano is strongly left-skewed. The Coenzyme Q₁₀ shift (Figure 1) is one of the coral points near the upper-left of the plot; the ubidecarenone label appears in the manuscript-figure version.
Summary
Two observations are worth surfacing beyond the manuscript-level treatment.
First, ubidecarenone (Coenzyme Q₁₀) is depleted in PDAC tumor tissue relative to adjacent normal pancreas at an effect size and significance comparable to the phospholipid classes that dominate the signature. Neither this direction nor an equivalent tissue-level measurement appears in the indexed PDAC literature.
Second, the same untargeted biochemical omics profile that produced the tumor-vs-normal signature also produced sample-level flags for specimens whose molecular composition does not match their assigned label, patterns consistent with low tumor cellularity, field-effect signal in adjacent-normal parenchyma, chronic pancreatitis, or acinar-to-ductal metaplasia.
Both classes of observation are outputs that a targeted or supervised analysis pipeline would not have surfaced. The utility of Pyxis in this setting is not the classifier accuracy but the interpretive layer that untargeted biochemical omics adds to bulk-tissue cancer studies. This is poly-intelligence in practice: Pyxis surfaced signals from the untargeted data that a targeted assay or a human reviewer might miss for a variety of reasons and implemented an agentic scientific diligence process to refine and validate findings.
References
[1] Yen H-C, Chen B-S, Yang S-L, et al. Levels of Coenzyme Q₁₀ and several COQ proteins in human astrocytoma tissues are inversely correlated with malignancy. Biomolecules 2022;12(2):336. PMID 35204836.
[2] Dadali T, Diers AR, Kazerounian S, et al. Elevated levels of mitochondrial CoQ₁₀ induce ROS-mediated apoptosis in pancreatic cancer. Sci Rep 2021;11:5749. PMID 33707480.
[3] Zhang R, Peng X, Du JX, et al. Oncogenic KRASG12D reprograms lipid metabolism by upregulating SLC25A1 to drive pancreatic tumorigenesis. Cancer Res 2023;83(22):3739–52. PMID 37695315.
[4] Li QK, Hu Y, Chen L, et al. Neoplastic cell enrichment of tumor tissues using coring and laser microdissection for proteomic and genomic analyses of pancreatic ductal adenocarcinoma. Clin Proteomics 2022;19(1):36. PMID 36266629.
[5] Guo JA, Hoffman HI, Weekes CD, Zheng L, Ting DT, Hwang WL. Refining the molecular framework for pancreatic cancer with single-cell and spatial technologies. Clin Cancer Res 2021;27(14):3825–33. PMID 33653818.
[6] Sivapalan L, Kocher HM, Ross-Adams H, Chelala C. The molecular landscape of pancreatic ductal adenocarcinoma. Pancreatology 2022;22(7):925–36. PMID 35927150.
[7] Alonso-Curbelo D, Ho Y-J, Burdziak C, et al. Plasma metabolome profiling identifies metabolic subtypes of pancreatic ductal adenocarcinoma. Cells 2021;10(7):1821. PMID 34359990.
[8] Casolino R, Beugels J, Simons A, et al. Inflammation-associated intramyocellular lipid alterations in human pancreatic cancer cachexia. J Cachexia Sarcopenia Muscle 2024;15(4):1283–97. PMID 38725139.
[9] Zhang G, He P, Tan H, et al. Integration of metabolomics and transcriptomics revealed a fatty acid network exerting growth inhibitory effects in human pancreatic cancer. Clin Cancer Res 2013;19(18):4983–93. PMID 23918603.
[10] Amrutkar M, Guttorm SJT, Labori KJ, et al. Reduced lipid metabolite abundance in human pancreatic cancer and matched serum samples following neoadjuvant FOLFIRINOX treatment. Metabolomics 2026;22(1):18. PMID 41553593.
[11] Liu Y, He X, Jiang X, et al. FNA-based lipidomics reveals coordinated lipid metabolic remodeling in pancreatic cancer. Front Mol Biosci 2026 (advance of print). DOI 10.3389/fmolb.2026.1823383.
[12] Wolrab D, Jirásko R, Cífková E, et al. Lipidomic profiling of human serum enables detection of pancreatic cancer. Nat Commun 2022;13(1):124. PMID 35013261.
[13] Naudin S, Sampson JN, Moore SC, et al. Lipidomics and pancreatic cancer risk in two prospective studies. Eur J Epidemiol 2023;38(7):783–93. PMID 37169992.
[14] Yousf S, Glunde K, Brown DR, et al. Fingerprinting the metabolic and lipidomic landscapes of pancreatic ductal adenocarcinoma with MALDI imaging. Clin Cancer Res 2025 (advance of print). PMID 42043783.
[15] Wang S, Wen S, Guo P, Liu H, Feng J, Huang H. Understanding metabolomic characteristics of PDAC by HR-MAS NMR detection of pancreatic tissues. J Pharm Biomed Anal 2020;190:113546. PMID 32846403.
[16] Zhao R, Ren S, Li C, et al. Biomarkers for pancreatic cancer based on tissue and serum metabolomics analysis in a multicenter study. Cancer Med 2022;12(4):5158–71. PMID 36161527.
Keep reading
A reanalysis of untargeted tissue lipidomics surfaced two signals a targeted panel would never have asked for.
Discover the meaning in your measurements
Engage with Pyxis on a new experiment or discover the novel biology hidden in data you already have.