Expertise Brief
New Expertise Brief
Generative cell line and bioprocess optimization for improving antibody drug titer
Pyxis now reads a bioreactor time course data set, resolves the metabolism that limits antibody titer, and recommends both process and production host optimizations, prepared to defend them against the biology and the literature.
Pyxis™ is the Matterworks co-scientist for interpreting omic data and predicting phenotypic biology. Pyxis’ expertise spans several domains, drawing on a set of expert models at our disposal. One of those domains is biochemical omics, the study of small molecules, lipids, and peptides by mass spectrometry, and this brief shows one aspect of that work: reading a bioreactor time course and generating recommendations to raise antibody titer. Pyxis brings PhD-level knowledge to it and works the way careful scientists do, reading the biology, forming a mechanistic hypothesis, testing it against independent evidence, and only then generating a recommendation.
The case here is a Chinese hamster ovary (CHO) fed-batch culture producing a monoclonal antibody, sampled daily from Day 0 through Day 13 in two parallel bioreactors. [17][18] Pyxis profiled the intracellular metabolome and reported roughly two hundred metabolites as absolute concentrations in micromolar units, then worked from those concentrations to a prioritized optimization plan.
A concentration is what makes a recommendation possible
Conventional untargeted mass spectrometry returns relative peak areas. Those tell you the direction of a change, that aspartate went down or lactate went up, but not the amount. Direction alone rarely supports an intervention. You cannot set a feed target, define a monitoring threshold, or choose a dose from an arrow.
Pyxis reports absolute concentrations in micromolar units for untargeted features, without per-analyte calibration standards, because the Large Spectral Model (LSM) learns quantitation directly from fragmentation across a large chemical space.[1][2] That single change is what turns an observation into an instruction. “Aspartate is depleted” becomes “aspartate fell from 1,603 µM to 92 µM during peak biosynthetic demand,” a quantity a process scientist can act on. Every recommendation in this brief rests on a measured concentration.
Reading the culture
Pyxis first resolves the shape of the run. Principal component analysis of the concentration matrix separates the thirteen days into four metabolic states, inoculation, exponential growth, stationary production, and decline, and the two bioreactors track together at every time point (Pearson r above 0.90). The close agreement between replicates confirms that the trajectory reflects the biology of the run rather than measurement variation.
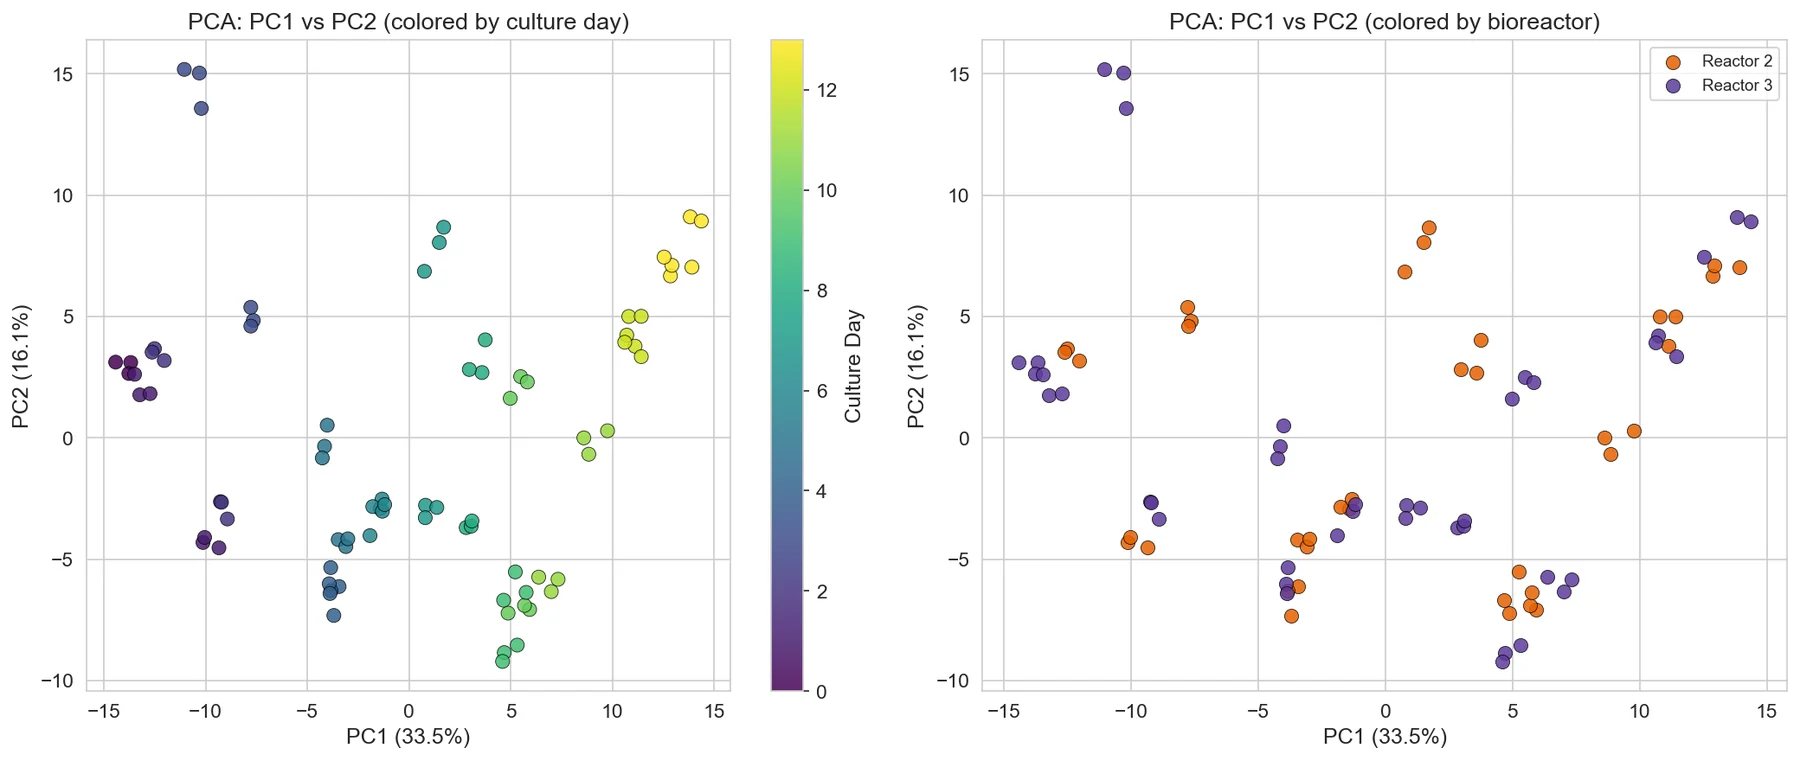
Figure 1. Principal component analysis of the intracellular metabolite matrix. Left, samples colored by culture day, tracing a path from inoculation through decline. Right, the same samples colored by bioreactor, with the two replicates overlapping closely at each time point.
Within that structure Pyxis reads a coherent story. Aerobic glycolysis runs throughout, with lactate accumulating from 406 to 548 µM as pyruvate falls, a well-characterized carbon inefficiency in CHO culture. [3] Amino acid pools are drawn down through exponential growth, and alanine climbs from 238 to 778 µM as cells excrete nitrogen. Two depletions stand out for their depth and timing: asparagine falls 97.9% to 17 µM by Day 5, and aspartate falls 94.2% to 92 µM by Day 9, both at the moment of highest biosynthetic demand. Choline falls 93% to 5.3 µM by Day 13. These are the constraints on titer.

Figure 2. Row-standardized intracellular amino acid concentrations by culture day. Most pools are enriched early and drawn down through exponential growth. Alanine and citrulline rise late. Glycine is excluded as a low-mass detection artifact.
Testing each read against independent evidence
A concentration trace can mislead, and Pyxis treats a process read with the same discipline as a de novo annotation. Pyxis does not report a pattern without first trying to break it. As partners, we press on the same reads, and Pyxis defends or revises each one against the evidence we raise.
The combined fumarate and malate signal rises 2.4-fold over the run. Before crediting that to metabolism, Pyxis separates the plausible mechanisms, partial fumarase or malate dehydrogenase limitation, glutamine-driven anaplerosis, and stoichiometric fumarate release from the urea cycle, from a competing confound: from the stationary phase onward, lysing cells contribute their contents to the centrifuged pellet. Pyxis uses timing and orthogonal markers to bound that contribution. The early rise from Day 1 to Day 8 precedes significant lysis and reads as genuine flux, while the late rise coincides with climbing hypoxanthine and inosine, purine catabolites that mark nucleotide-pool release. Pyxis reports the flux and the artifact separately rather than folding them together.
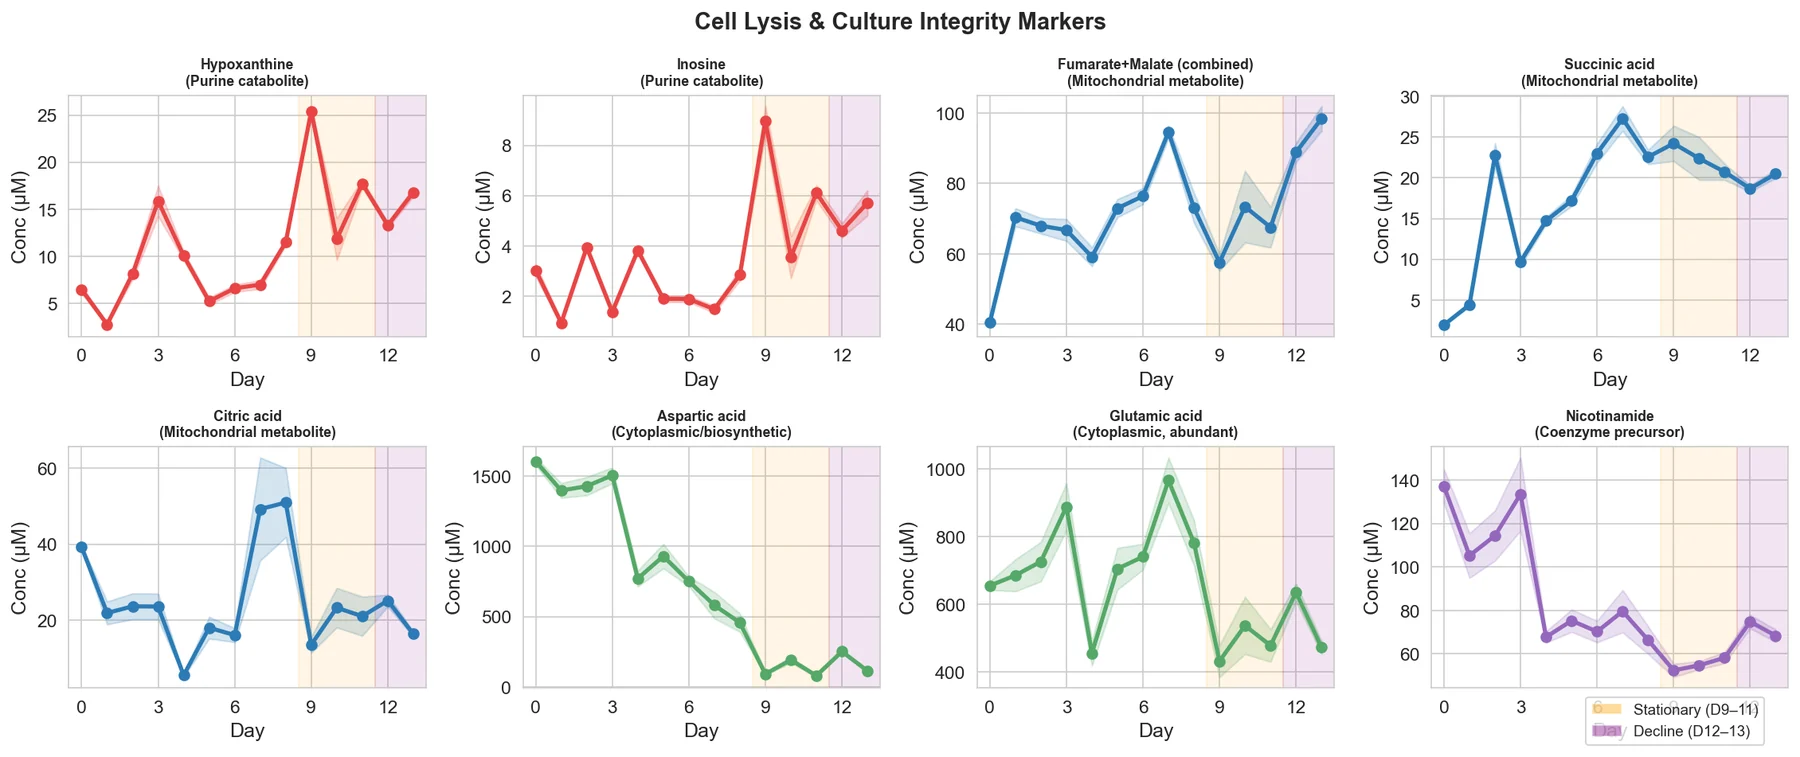
Figure 3. Candidate cell-integrity markers across the culture, with the stationary phase (Days 9 to 11) and decline phase (Days 12 to 13) shaded. Timing and orthogonal markers let Pyxis distinguish genuine metabolic flux from a lysis contribution to the pellet signal.
The same care governs analyte identity. Pyxis confirms that cysteine and cystine are distinct measurements, with divergent concentration profiles and separate retention times, so their independent biological signals are not collapsed into one. Pyxis excludes glycine, which sits at the low-mass boundary where in-source fragmentation distorts quantitation, rather than passing an artifact forward as biology. A recommendation built on a misread is worse than no recommendation.
Generating the recommendations
From the tested read Pyxis generates a prioritized intervention plan. Each recommendation names the mechanism, cites the measured concentrations that trigger it, and carries an expected effect on titer with literature precedent. Aspartate availability is itself a documented limit on proliferation,[4] which is why the amino acid depletions lead the plan.
Intervention
What Pyxis measured
Mechanism
Anticipated Improvement
P1
Asparagine and aspartate feed supplementation, beginning Day 2 to 3
Asparagine 797 → 17 µM by D5; aspartate 1,603 → 92 µM by D9
Restores substrate for antibody synthesis, N-glycosylation, nucleotide synthesis, and TCA anaplerosis at peak demand
15 to 30% titer improvement and improved Fc galactosylation with asparagine supplementation [5]
P2
Choline replenishment, from Day 4 to 5
Choline 80.4 → 5.3 µM, with glycerol-3-phosphate accumulating in parallel
Relieves the phosphatidylcholine head-group limitation in the Kennedy pathway, localized by the concurrent backbone accumulation
15 to 20% improvement in integrated viable cell density with optimized choline feeding [6]
P2
Reduce aerobic glycolysis: LDHA knockdown or pyruvate carboxylase overexpression
Lactate 406 → 548 µM with declining pyruvate throughout
Redirects pyruvate from lactate toward the TCA cycle, recovering carbon for energy and biosynthesis
Up to 50% titer improvement with LDHA reduction; [7] 20 to 35% with pyruvate carboxylase overexpression [8]
P3
Cystine supplementation at the Day 5 feed
Cystine 28.3 → 2.4 µM by D9
Sustains cysteine and glutathione supply for redox balance and disulfide bond formation in the secretory pathway
Supports secretory-pathway capacity into the production phase
P3
NAD⁺ precursor supplementation at Days 5 and 9
Nicotinamide 137 → 52 µM by D9 (62%)
Supports the NAD⁺ salvage pathway and oxidative NADH reoxidation as growth slows
Precedent for reduced lactate accumulation in mid-to-late culture [9]
P1, P2, and P3 denote the priority Pyxis assigns each intervention by the strength of the underlying measurement.
Pyxis also generates the measurements that will confirm the plan in the next run. Because the readout is quantitative, those come as concrete thresholds rather than trends: hypoxanthine above 15 µM around Day 7 to 8 as an early indicator of approaching decline, and intracellular choline below 15 µM as a trigger for a choline bolus. A monitoring panel written in micromolar units closes the loop between a recommendation and its verification.
What this means
Pyxis has demonstrated the necessary expertise to read supernatant and intracellular biochemistry for cell based production systems, reason across connected metabolic and plasmid optimization pathways, and propose high-confidence interventions. Pyxis tests assumptions against measured data and defines the sequence of experiments to confirm the optimizations in the next campaign. This is a repeatable process with broad applicability to Best Process at Launch efforts in the biomanufacturing and synthetic biology sectors.
Two quantities set much of a program’s manufacturing economics: the rate at which a bioreactor turns feed into drug substance, and the number of runs required to reach a target mass. Antibodies are dosed at high mass and often across long treatment courses, and industry market analyses estimate the therapeutic antibody market above $250 billion in 2024. [16] Output per unit of time and cost per gram both track with titer, which is why it has been a primary determinant in process development for two decades. [10][12] Fed-batch titers have moved from 0.5 to 1 gram per liter in the early 2000s to 3 to 8 grams per liter at commercial scale, with intensified processes above 10. [11][15] Over the same period, reported cost of goods for a fed-batch process reached around $100 per gram at a 500 liter scale and below $50 per gram in intensified processes, with the titer gains alone accounting for a two- to five-fold reduction in cost per gram. [13][15]
Against that backdrop, consider a 30 to 50 percent titer increase. At fixed bioreactor volume and recovery, drug substance output scales with titer, so the same facility yields 30 to 50 percent more product per campaign. Read from the other direction, a fixed annual mass is reached in about 23 to 33 percent fewer batches. A company running its own plant can take this as added output from capacity already built and paid for, with suite time freed for a second product. A contract manufacturer, whose batch price is driven by how long a suite is occupied, gains a lower cost per gram and additional slots to sell across the year. [12][14] Because titer is set upstream, in the cell line and the feed, the recommendations in this brief act on the part of the process that carries these effects.
The loop reads that upstream biology from data a group already holds, then returns interventions with measured concentrations and expected effects attached, together with the measurements that will confirm them in the next run. Generative optimization of cell line and process is one area of expertise in a repertoire that continues to grow as Pyxis learns from new spectra.
References
Ferro LS, Wong AYL, Howland J, Costa ASH, Pruyne JG, Shah D, Lauterbach JD, et al. (2024). A scalable approach to absolute quantitation in metabolomics. bioRxiv. doi:10.1101/2024.09.09.609906.
Asher G, Delmar MC, Campbell JM, Geremia J, Kassis T (2024). LSM1-MS2: a foundation model for MS/MS, encompassing chemical property predictions, search, and de novo generation. chemRxiv. doi:10.26434/chemrxiv-2024-k06gb-v3.
Mulukutla BC, Gramer M, Hu WS (2012). On metabolic shift to lactate consumption in fed-batch culture of mammalian cells. Metab Eng 14(2):138–149.
Sullivan LB, Gui DY, Hosios AM, Bush LN, Freinkman E, Vander Heiden MG (2015). Supporting aspartate biosynthesis is an essential function of respiration in proliferating cells. Cell 162(3):552–563.
Fan Y, Del Val IJ, Muñoz-Ruiz C, et al. (2015). Amino acid and glucose supplementation improves the performance of CHO cell cultures producing antibodies. Biotechnol Bioeng 112(3):521–535.
Wlaschin KF, Hu WS (2006). Fed-batch culture and dynamic nutrient feeding. Adv Biochem Eng Biotechnol 101:43–74.
Kim SH, Lee GM (2007). Functional expression of human pyruvate carboxylase for reduced lactic acid formation of Chinese hamster ovary cells. Appl Microbiol Biotechnol 76(3):659–665.
Zagari F, Jordan M, Stettler M, Broly H, Wurm FM (2013). Lactate metabolism shift in CHO cell culture: the role of mitochondrial oxidative activity. N Biotechnol 30(2):238–245.
Rajman L, Chwalek K, Sinclair DA (2018). Therapeutic potential of NAD-boosting molecules: the in vivo evidence. Cell Metab 27(3):529–547.
Kelley B (2009). Industrialization of mAb production technology: the bioprocessing industry at a crossroads. mAbs 1(5):443–452.
Kelley B, Kiss R, Laird M (2018). A different perspective: how much innovation is really needed for monoclonal antibody production using mammalian cell technology? Adv Biochem Eng Biotechnol 165:443–462.
Farid SS (2007). Process economics of industrial monoclonal antibody manufacture. J Chromatogr B 848(1):8–18.
Klutz S, Holtmann L, Lobedann M, Schembecker G (2016). Cost evaluation of antibody production processes in different operation modes. Chem Eng Sci 141:63–74.
Kelley B (2024). The history and potential future of monoclonal antibody therapeutics development and manufacturing in four eras. mAbs 16(1):2373330.
Sartorius (2026). Breaking the $50/g barrier in mAb manufacturing is now within reach. Sartorius technical article.
Precedence Research (2025). Monoclonal antibodies therapeutics market. Industry market analysis.
Gorre E, Gomez JD, Dorst K, Zhai B, Mahan A, Howland J, Feld GK, Ubhi BK (2026). Case study: J&J CHO cell productivity. https://www.matterworks.ai/insights/case-study-cho-cell-jnj
Gorre E, Dorst K, Zhai B, Mahan A, Gomez Castro J, Howland J, Ubhi BK (2025). A scalable machine learning-based platform for absolute quantitation of metabolites to elucidate CHO cell metabolism. Poster MP626, ASMS Conference on Mass Spectrometry and Allied Topics, June 2, 2025.
Keep reading
Pyxis reads a bioreactor time course, resolves the metabolism limiting titer, and recommends process changes.
Discover the meaning in your measurements
Engage with Pyxis on a new experiment or discover the novel biology hidden in data you already have.