White Paper
The Economics of Biochemical Omics:
Cost and Turnaround at Parity with Sequencing
A companion to Scalable Biochemical Omics: Achieving Parity with Sequencing. This note sets out the per-sample cost and turnaround of biochemical omics against the sequencing modalities. On the Pyxis platform, a full three-class biochemome runs at 0.85 times the cost of a 30x genome and returns in the time of a genome, so biochemical omics is now scalable, fast, and accessible.
Application Note · Cost and Turnaround · July 2026
Summary
Genomics, transcriptomics, and proteomics support discovery at a fully-loaded cost in the low hundreds of dollars per sample. Quantitative biochemical omics has stood apart, at about $1,431 per sample, close to nine times a whole genome. On a laboratory’s own instrument, the Pyxis™ platform measures small molecules and lipids for about $75 per sample and adds peptides for about $52 per sample. The full three-class biochemome readout is therefore $127 per sample, which is 0.85 times the cost of a 30x genome, and it returns in the time of a genome. Biochemical omics is now scalable, fast, and accessible. As its economics normalize with sequencing, we expect the volume of biochemical omics being run to increase substantially.
1. Result: biochemical omics at parity
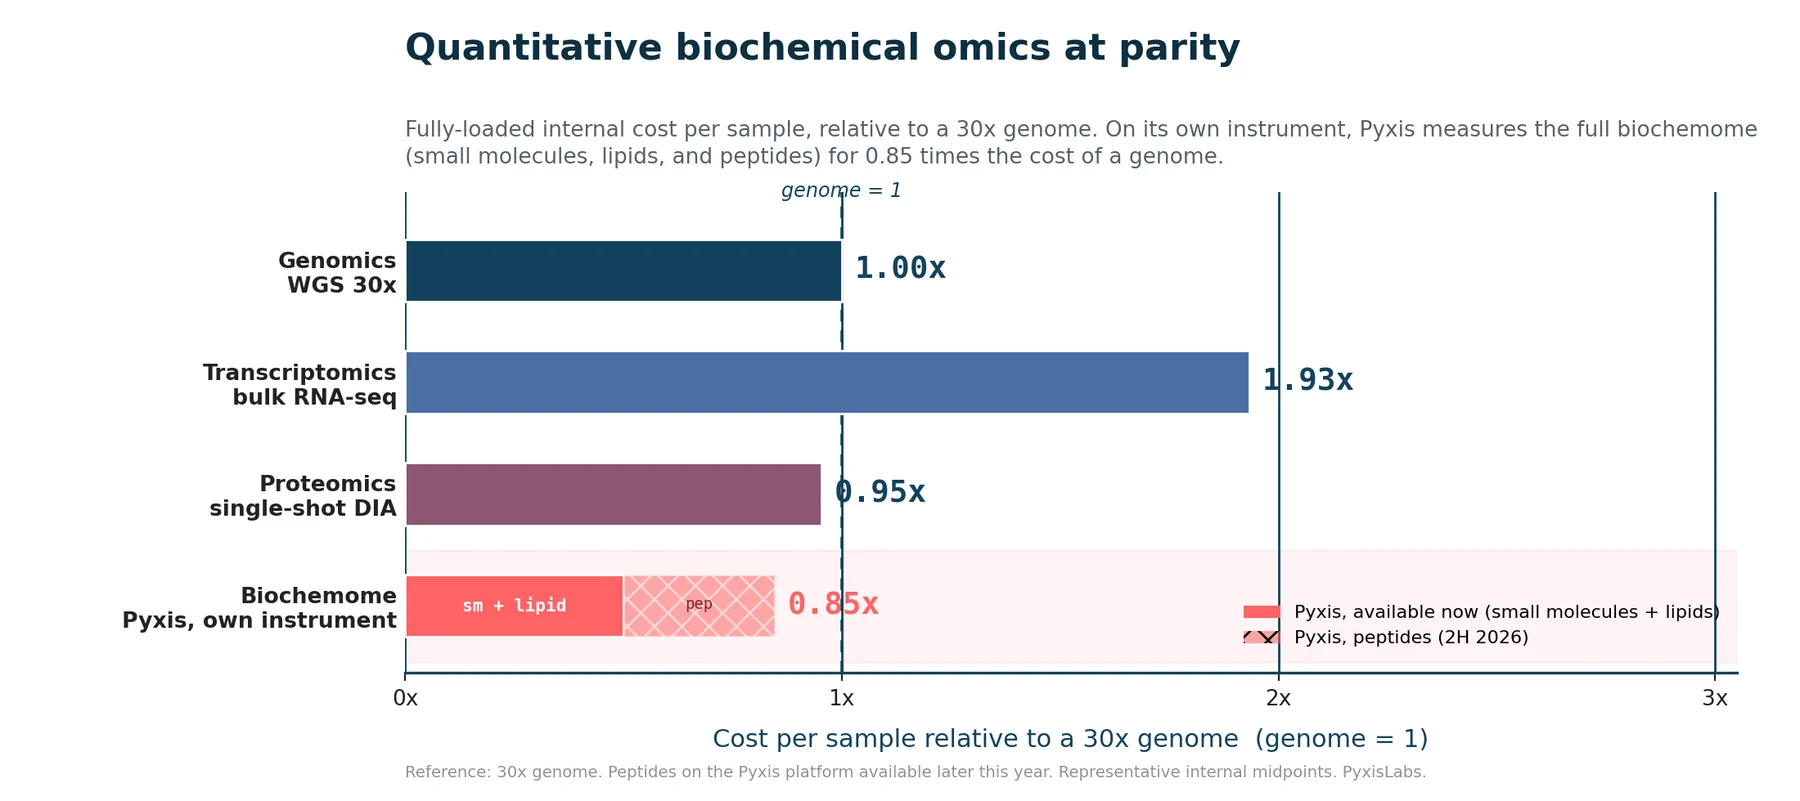
Reported relative to a 30x genome, the Pyxis biochemome readout costs less than a genome, alongside a high-throughput single-shot proteome and below transcriptomics.
On a laboratory’s own instrument, Pyxis measures small molecules and lipids for about $75 per sample and peptides for about $52 per sample, both figures fully loaded for consumables, labor, and instrument time. Small molecules and lipids are available today; peptides follow later this year. The complete readout is $127 per sample, or 0.85 times a genome.
Pyxis, own instrument, fully loaded
0.85x a genome for the full biochemome · $127 per sample ($75 small molecules + lipids today, $52 peptides in 2H 2026)
Pyxis parity, relative scale
Figure 1. Fully-loaded internal cost per sample relative to a 30x genome. The Pyxis biochemome readout is 0.85 times a genome on an owned instrument.
Two properties of the platform produce this cost. Pyxis performs concentration prediction computationally, which reduces reliance on a physical calibration standard for every analyte, the line item that dominates conventional quantitative cost. Each method is also read untargeted, so a single acquisition returns a broad, quantified analyte set and removes the per-analyte targeted assays that conventional quantitation stacks within a chemical class. A complete biochemome still requires several methods, including reversed-phase and HILIC for small molecules, a dedicated lipid method, and a peptide method, run in one or both ionization modes, so the per-sample figures reported here are the sum of those runs. The remainder of this paper sets out the cost structure that places conventional biochemical omics where it is, then details the operating regimes and turnaround for each modality.
2. The cost structure of a measurement
Per-sample cost across the omics follows three properties of the measurement, and the ordering of the modalities follows from them.
Multiplexing
Barcoded sequencing pools hundreds to thousands of samples in one run, sharing its cost across all of them. Mass spectrometry acquires most samples one at a time; isobaric labeling raises the ceiling to about 18 to 35.
Amplification
DNA and RNA are copied enzymatically, so small inputs give abundant signal. Proteins and metabolites cannot be amplified, so the instrument measures native abundance across a wide dynamic range.
Quantitation
Sequencing quantitates by counting reads, a digital census that needs no physical reference. Mass-spectrometry response varies across analytes by orders of magnitude, so quantitation requires a labeled calibration standard for each analyte.
Genomics benefits from all three properties, and transcriptomics from the first two. Modern high-duty-cycle instruments have narrowed the multiplexing gap for proteomics, and a protein yields a usable relative measurement from a single acquisition, so a single-shot proteome is inexpensive. The measurement that still requires a physical calibration standard for every analyte is the biochemome, where small molecules, lipids, and peptides occupy distinct chemical space and are quantified as separate calibrated assays. A complete biochemome readout therefore carries the full cost of quantitation three times over.
3. The conventional quantitative cost order
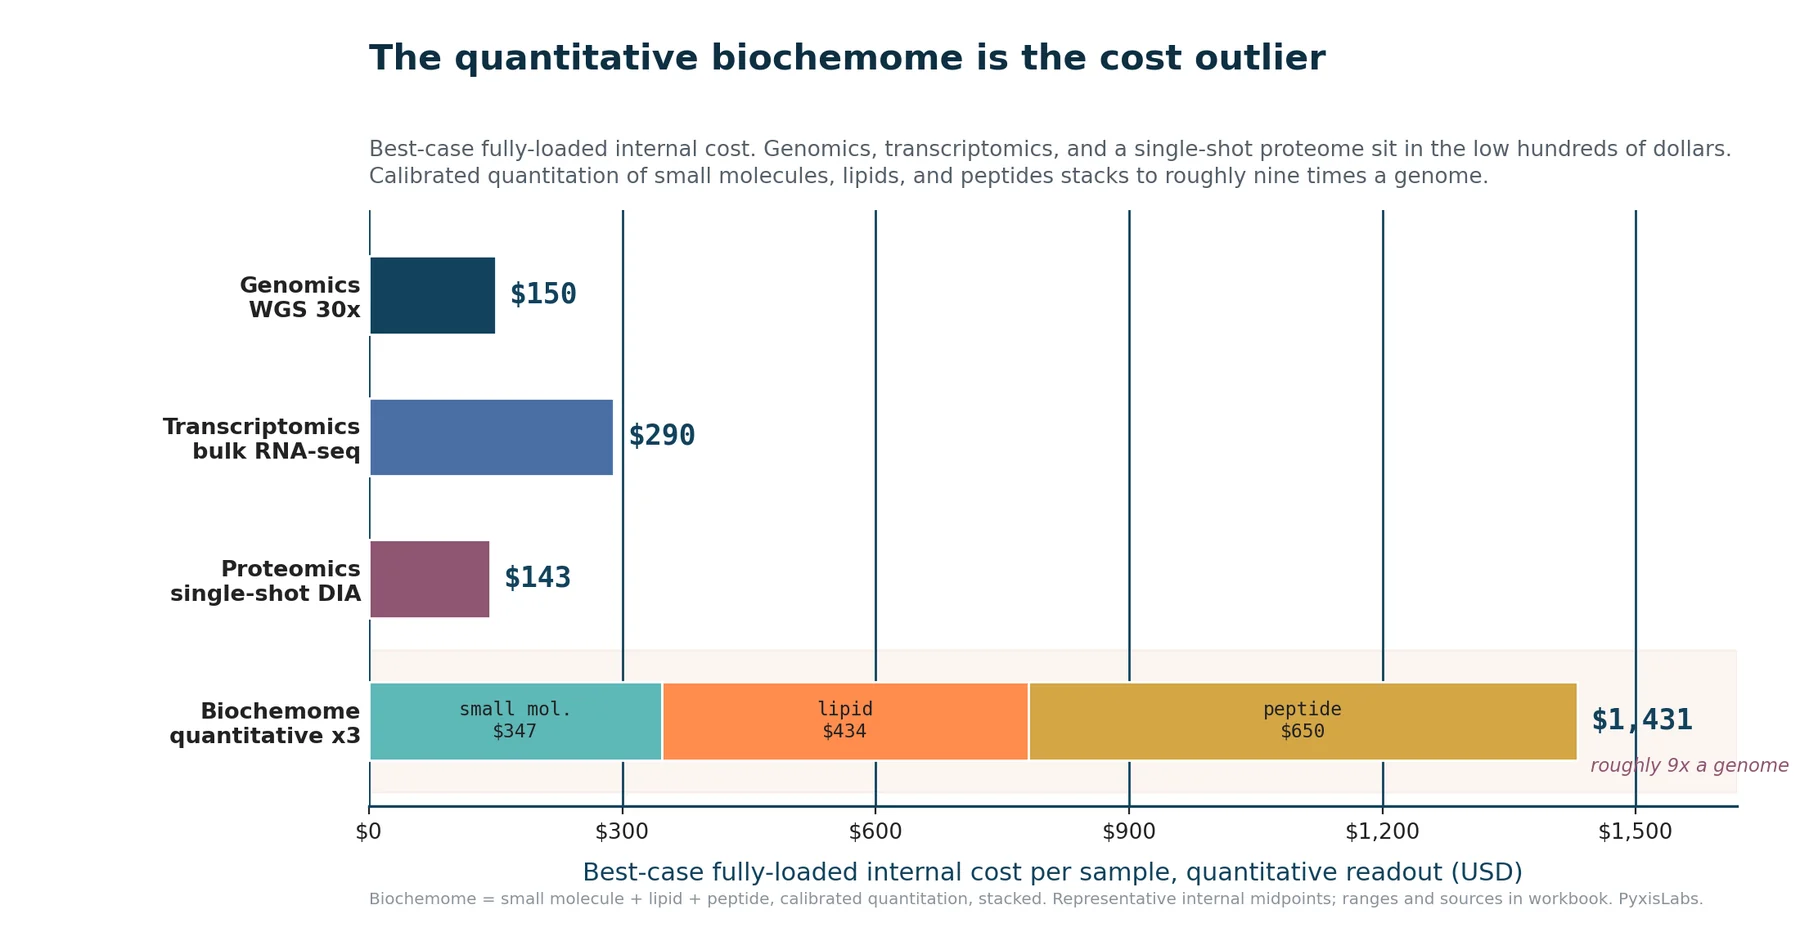
On a fully-loaded internal basis at discovery scale, the modalities sit at a 30x genome at about $150 per sample, a bulk transcriptome at about $290, a single-shot proteome at about $143, and a quantitative biochemome at about $1,431. The biochemome figure sums three calibrated assays: a small-molecule panel at about $347, quantitative lipidomics at about $434, and targeted quantitative peptides at about $650.
Quantitative cost ordering
Figure 2. Best-case fully-loaded internal cost per sample on a quantitative basis. Conventional biochemical omics stacks three calibrated assays to about nine times the cost of a genome.
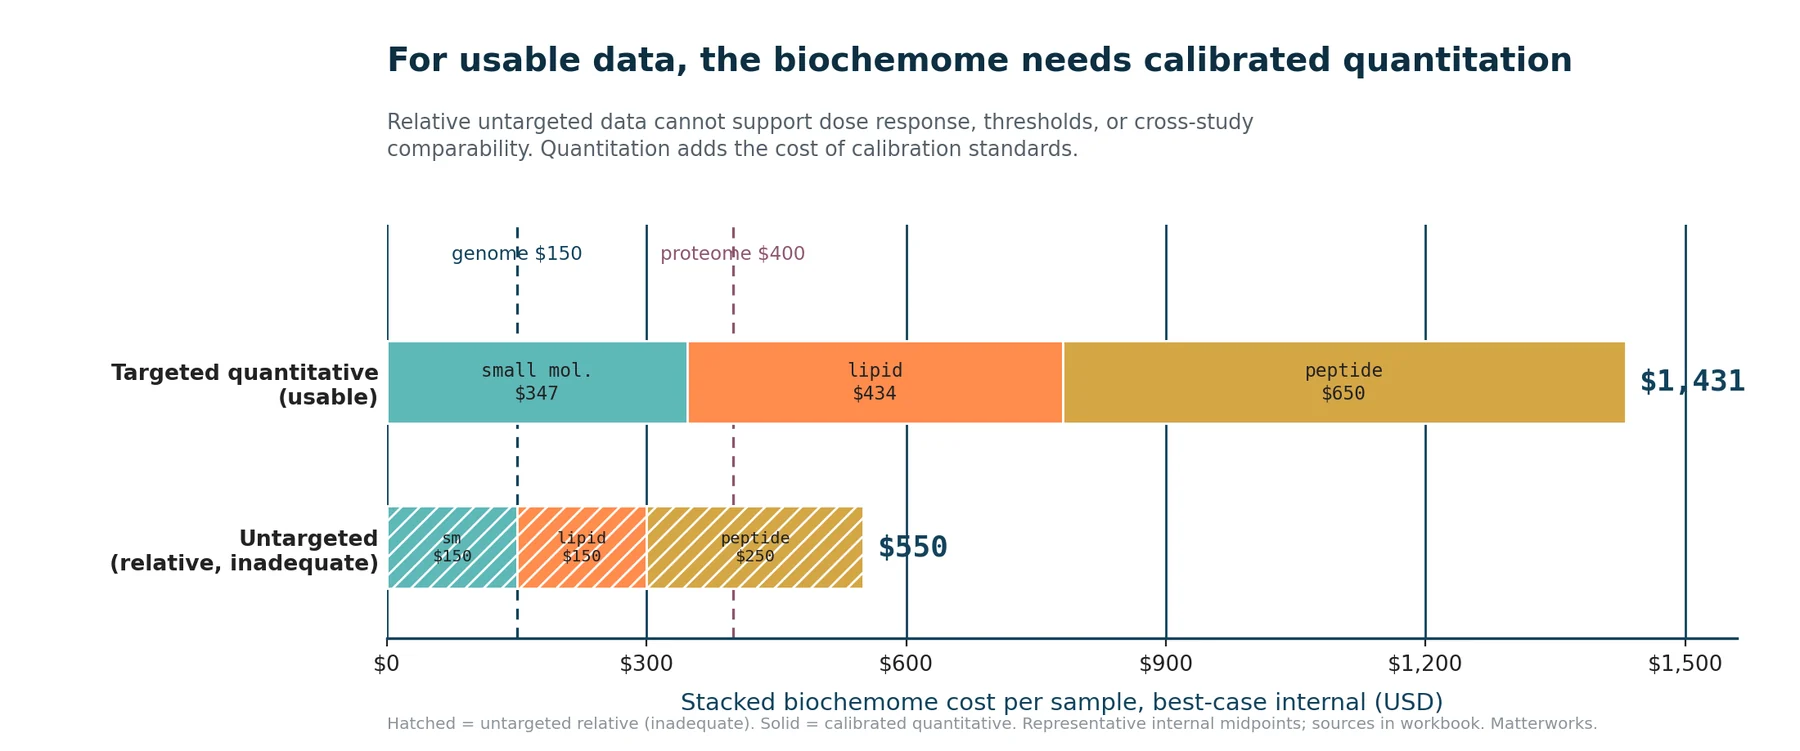
The requirement for quantitation is what places biochemical omics at the top. Relative untargeted profiling is available at lower cost and supports grouping compounds by mechanism. It does not support dose response, thresholds, pharmacokinetic and pharmacodynamic modeling, or comparison across studies, because untargeted signal is not comparable across analytes, batches, or laboratories.[17] For those questions, calibrated quantitation is the working floor, and the cost of the standards is the reason biochemical omics sits where it does.
Relative versus quantitative biochemome
Figure 3. Relative untargeted profiling of the biochemome (about $550 stacked) against calibrated quantitation (about $1,431 stacked). The difference is the cost of standards.
3.1 Why standards set the price
Small-molecule standards are the most economical, because labeled internal standards are commercially catalogued and packaged in validated kits. The Biocrates MxP Quant 500 XL reports quantitative values for about 1,000 metabolites and lipids using labeled standards and seven-point calibration curves, at about $347 per sample fully loaded.[15] Lipid quantitation runs about 25 percent higher, driven by the breadth and cost of class-specific standards. Peptides are the most method-dependent: quantitation requires targeted acquisition with stable-isotope-labeled standards synthesized for each target, and the synthesis and purification of those standards is what makes such assays expensive.[16] There is no untargeted quantitative equivalent for peptides, which places quantitative peptidomics at the top of the stack at about $650 per sample.
4. Operating regimes and cost ranges
Each modality spans about an order of magnitude, set by the readout depth a program requires. Table 1 summarizes the regimes on a fully-loaded internal basis, with cost shown in dollars and relative to a genome.
Modality
Screening floor
Comprehensive
Quantitative (usable)
Ref.
Genomics
$20–100 · 0.1–0.7x
array, low-pass
$150 · 1.0x
30x WGS
$150 · 1.0x
digital
1,2,18
Transcriptomics
$100 · 0.7x
low-input / 3-prime
$290 · 1.93x
bulk RNA-seq
$290 · 1.93x
digital
3,5,7
Proteomics
$50–100 · 0.3–0.7x
fast DIA, marginal
$125–150 · 0.8–1.0x
single-shot DIA
$400–1,000 · 3–7x
deep or targeted SIS
10,11,12
Biochemome, conventional
$30–400
untargeted, relative
$550
untargeted, relative
$1,431 · 9.5x
calibrated x3
13,14,15,16,17
Biochemome, Pyxis
n/a
$75 · 0.5x
sm + lipid
$127 · 0.85x
sm + lipid + peptide
PxL
Table 1. Fully-loaded internal cost per sample and cost relative to a 30x genome. The biochemome is shown on both a conventional and a Pyxis basis.
4.1 Genomics
Genomics spans the widest range of the sequencing modalities. For population studies, genotyping arrays measure a fixed set of common variants for about $20 to $50 per sample, and low-pass whole-genome sequencing with imputation reaches comparable common-variant accuracy at $40 to $100.[18] A 30x whole genome, the comprehensive readout, is about $150 per sample on an owned instrument, consistent with the $200 consumables figure for the highest-throughput flow cell[2] and with the production costs the National Human Genome Research Institute has tracked since 2001.[1] A complete, telomere-to-telomere assembly sits at the high end, requiring several platforms in combination and heavy assembly compute, at a cost that has fallen from tens of thousands of dollars in 2019[9] toward a few thousand today.[8] Genomics is quantitative by construction, since a genotype is a discrete call and coverage is a count.
4.2 Transcriptomics
Transcriptomics spans from about $100 per sample for high-throughput, low-input library preparations to about $290 for a whole-transcriptome bulk RNA-seq, the comprehensive readout. Single-cell RNA-seq sits at the high end, at $2,000 to $3,500 per sample, set by library preparation and deep sequencing.[7] Purpose-built compound-screening assays such as DRUG-seq and BRB-seq reach lower by barcoding at the plate and sequencing shallowly,[3,5] a regime specific to large screens rather than general profiling. Read counts provide relative quantitation without added reagents.
4.3 Proteomics
Proteomics has moved with instrument throughput. A 2025 report demonstrated about 8,000 proteins from a 10 nanogram input for roughly $10 in reagents on high-duty-cycle instruments.[10] Fully loaded at high throughput, a single-shot data-independent-acquisition proteome runs about $125 to $150 per sample, which is the discovery operating point used on the parity plot and is below the cost of a bulk transcriptome. That readout provides reproducible relative quantitation, which supports differential discovery in the way read counts do for transcriptomics. Higher coverage or absolute quantitation costs more: a deep proteome that quantifies 7,000 to 10,000 proteins by fractionation or isobaric labeling runs $400 and above,[11,12] and targeted absolute quantitation with labeled standards runs higher still, alongside quantitative peptidomics.
4.4 Biochemical omics
Biochemical omics presents two cost structures. Untargeted profiling for screening is inexpensive: flow-injection and acoustic-ejection mass spectrometry acquire a sample in seconds and detect thousands of features,[13,14] so a relative small-molecule or lipid readout costs tens to a few hundred dollars per sample. That readout is relative. Ionization efficiency varies across analytes by orders of magnitude, so untargeted signal does not support quantitation across analytes, batches, or studies. Calibrated quantitation is the working requirement, and its cost follows the sourcing of standards, as set out in Section 3.1. A further cost applies to coverage: a single platform captures between 16 and 70 percent of even one analyte class, so comprehensive coverage requires several assays in combination.[17] Pyxis addresses both the standards cost and the stacked-assay penalty, which is the basis of the result in Section 1.

Screening floor to comprehensive, internal
Figure 4. Fully-loaded internal cost per sample from a lower operating point to a comprehensive or quantitative readout, log scale. Genomics, transcriptomics, and proteomics span the low hundreds; the calibrated quantitative biochemome reaches about $1,431, per Section 3.

Tiered CRO cost ranges
Figure 5. Contract-service pricing by tier, low (accessible) to high (specialized), for each modality. CRO and service basis, provided for contrast with the internal figures above.
5. Internal cost against contract-service pricing
Running on an owned instrument converts capital and staffing into a low marginal per-sample cost, and it rewards sustained volume. A contract laboratory converts that fixed cost into a per-sample price, removes the capital requirement, and adds a margin for handling and interpretation. Table 1 and Figure 5 give the ranges for the conventional modalities on internal and contract-service bases. The Pyxis figures in this paper are internal, own-instrument costs.
6. Turnaround time
Turnaround follows the same structure as cost, and it is reported here relative to a 30x genome. Sequencing returns data to a laboratory in about two weeks through a service,[23] which sets the reference. Conventional quantitative biochemical omics is slower for a specific reason: a targeted quantitative method requires calibration standards to be sourced or synthesized and the assay to be developed and validated before the first sample is measured. For peptides, that development includes synthesizing and characterizing a labeled standard for each target, and stacking three chemical classes compounds the timeline. A full stacked quantitative biochemome runs roughly six times the turnaround of a genome, well beyond even an accelerated commercial metabolomics service.[22]
Pyxis derives quantitation computationally, so turnaround is set by acquisition and analysis rather than by standard procurement or per-analyte method development. The methods run untargeted on standardized acquisitions, and quantitation is computed after the run. On the platform a full three-class biochemome returns in the time of a genome. Biochemical omics is delivered at sequencing speed.

Relative turnaround by modality
Figure 6. Turnaround relative to a 30x genome, sample to data. Pyxis returns a full biochemome in the time of a genome, against roughly six times for a stacked quantitative biochemome.
Workflow
Sample to data
× genome
Rate-limiting step
Genomics, WGS 30x
~2 weeks
1.0x
sequencing run, informatics
Transcriptomics, bulk
~2 weeks
1.0x
library prep, sequencing
Proteomics, discovery
~3–4 weeks
~1.8x
serial acquisition, search
Biochemome, conventional quantitative
~3 months
~6x
standard synthesis, method development, three stacked assays
Biochemome, Pyxis
~2 weeks
1.0x
—
Table 2. Representative turnaround, sample to data, relative to a 30x genome. Pyxis matches genomics because quantitation is computed after standardized acquisitions rather than built from per-analyte standards and method development.
7. Outlook: a market normalized with sequencing
Three barriers have kept biochemical omics from the scale sequencing reached: cost, turnaround, and access. Each is now addressed. The full three-class biochemome runs at 0.85 times a genome, so the work is scalable. It returns in the time of a genome, so it is fast. It runs on a laboratory’s own instrument, with quantitation computed rather than built from a physical standard for every analyte, so it is accessible without a specialized method-development program. Biochemical omics is scalable, fast, and accessible.
The market context frames the opportunity. Independent estimates place biochemical omics, led by metabolomics, at roughly $2 to $5 billion in 2025, growing at about 10 to 14 percent a year.[19] Sequencing is several times larger, on the order of $12 to $17 billion,[20] and its installed base of measured samples dwarfs the biochemical side: the principal public metabolomics repository holds on the order of 75,000 samples across roughly 2,400 studies,[21] against many millions of genomes sequenced. The gap is not one of biological value. It is the cost and turnaround penalty this paper describes.
Sequencing offers the precedent. As the cost of a genome fell by several orders of magnitude, the volume of sequencing and the market around it grew far faster than early forecasts anticipated.[1] Demand for genomic measurement proved highly responsive to price and speed. Removing the analogous penalties from biochemical omics is the same unlock, and we therefore expect the volume of biochemical omics to increase substantially as its economics normalize with sequencing.

Forward-looking market scenarios
Figure 7. Illustrative scenarios, not a forecast. A baseline trajectory at the current growth rate against a normalized trajectory nearer sequencing’s growth. Under normalization, biochemical omics reaches the scale of today’s sequencing market within the decade.
The scenarios in Figure 7 are illustrative. The baseline holds the current growth rate of about 11 percent a year. The normalized case applies a sequencing-like rate of about 18 percent, the pace the sequencing market itself has sustained. The difference between them is the headroom that normalized cost and turnaround create. Realized growth will depend on adoption across drug discovery, translational research, and diagnostics, where biochemical readouts carry information that sequencing does not. By making the measurement scalable, fast, and accessible, PyxisLabs™ is positioned to normalize biochemical omics with sequencing and to reshape the market that runs it.
8. Conclusion
The cost order of the omics reflects three properties of the measurement: how far it multiplexes, whether the analyte can be amplified, and how quantitation is obtained. Biochemical omics has stood at the top of that order because quantitation depends on a physical standard for each analyte and because a complete readout stacks three chemical classes. Pyxis changes this in two ways. It predicts concentrations computationally, which removes the physical standard for each analyte, and it reads each method untargeted, which replaces the per-analyte targeted assays within a class with a single broad acquisition. The three chemical classes are still measured on separate methods, and with the dominant standards cost removed the result is a full three-class biochemome at 0.85 times the cost of a genome and in the time of a genome, run on a laboratory’s own instrument. Biochemical omics is now scalable, fast, and accessible. The companion capability paper addresses the scientific completeness of that readout. Together they place biochemical omics at parity with sequencing on completeness, speed, and cost, and they point to a market that grows as the measurement normalizes with sequencing.
References
[1] Wetterstrand KA. DNA sequencing costs: data from the NHGRI Genome Sequencing Program. genome.gov.
[2] Illumina. NovaSeq X Series: the $200 genome (sequencing consumables at scale). illumina.com.
[3] Ye C, et al. DRUG-seq for miniaturized high-throughput transcriptome profiling in drug discovery. Nature Communications 2018;9:4307.
[4] Li J, et al. DRUG-seq provides unbiased biological activity readouts for neuroscience drug discovery. ACS Chemical Biology 2022;17:1401.
[5] Alpern D, et al. BRB-seq: ultra-affordable high-throughput transcriptomics enabled by bulk RNA barcoding and sequencing. Genome Biology 2019;20:71.
[6] Subramanian A, et al. A next generation connectivity map: L1000 platform and the first 1,000,000 profiles. Cell 2017;171:1437.
[7] Single-cell RNA-seq (10x) service pricing: academic core rate cards and commercial service quotations, 2025.
[8] PacBio Revio and the Telomere-to-Telomere consortium: complete human genome assembly by long-read sequencing.
[9] Cho YS, et al. Cost and characteristics of long-read de novo human genome assembly. GigaScience 2019.
[10] Huang EL, et al. Toward a ten-dollar proteome: high-throughput single-run proteomics on Astral and timsTOF. bioRxiv 2025.
[11] Thermo Fisher Center for Multiplexed Proteomics, Harvard Medical School: deep proteome (7,000 to 10,000 proteins) by TMT.
[12] NCI Protein and Metabolite Characterization Core: service costs for label-free and TMT proteomics.
[13] Nassar J, et al. Fast and sensitive flow-injection mass spectrometry metabolomics by analyzing sample-specific ion distributions. Nature Communications 2020;11:3227.
[14] Acoustic-ejection mass spectrometry for high-throughput hit identification. SLAS Technology 2025; and Zhang H, et al. 2021.
[15] Biocrates. MxP Quant 500 and Quant 500 XL: standardized quantitative targeted metabolomics (up to ~1,000 metabolites and lipids). biocrates.com.
[16] Gerber SA, et al. Absolute quantification (AQUA) with stable isotope-labeled synthetic peptides; and isotope-labeled protein standards for targeted quantitative proteomics. Molecular and Cellular Proteomics.
[17] Chaby LE, et al. Cross-platform evaluation of commercially available metabolomics assays. Metabolites 2021;11:632.
[18] Low-pass whole-genome sequencing and SNP genotyping arrays for population studies: method reviews and service pricing (array ~$20/sample). Azenta/GENEWIZ; population-genomics literature.
[19] Metabolomics market size and growth, 2025: Mordor Intelligence (USD 2.51B, 11.0% CAGR); Fortune Business Insights (USD 2.29B); Precedence Research (USD 4.31B, ~14% CAGR); FactMR (USD 5.0B). Drug discovery holds ~35% of market share.
[20] Next-generation sequencing market size, 2025: Grand View Research (USD 11.3B); MarketsandMarkets (USD 12.8B); Expert Market Research (USD 16.6B).
[21] National Metabolomics Data Repository / Metabolomics Workbench: ~75,000 samples across ~2,397 studies (principal public metabolomics repository).
[22] Metabolon. Accelerated 4-week (28-day) commercial turnaround, Global Discovery Panel, up to 2,000 samples. prnewswire.com; metabolon.com.
[23] Whole-genome sequencing service turnaround: research CRO ~1 to 3 weeks (SeqMatic; Genix.ai analysis 5 to 7 days); standard clinical ~4 weeks (GeneDx; Baylor Genetics).
Keep reading
A full three-class biochemome runs at 0.85x the cost of a 30x genome, and returns in the same time.
Discover the meaning in your measurements
Engage with Pyxis on a new experiment or discover the novel biology hidden in data you already have.